
The UK’s greenhouse gas emissions fell by 3.6% in 2024 as coal use dropped to the lowest level since 1666, the year of the Great Fire of London, according to new Carbon Brief analysis.
Major contributions came from the closure of the UK’s last coal-fired power station in Nottinghamshire and one of its last blast furnaces at the Port Talbot steelworks in Wales.
Other factors include a nearly 40% rise in the number of electric vehicles (EVs) on the road, above-average temperatures and the UK’s electricity being the “cleanest ever” in 2024.
Carbon Brief’s analysis, based on preliminary government energy data, shows emissions fell to just 371m tonnes of carbon dioxide equivalent (MtCO2e) in 2024, the lowest level since 1872.
Other key findings from the analysis include:
- The UK’s emissions are now 54% below 1990 levels, while GDP has grown by 84%.
- About half of the drop in emissions in 2024 was due to a 54% reduction in UK coal demand, which fell to just 2m tonnes – the lowest level since 1666.
- Another third of the drop in 2024 emissions was due to falling demand for oil and gas, with the remainder down to ongoing reductions in non-CO2 greenhouse gases.
- UK coal demand fell at power stations (one-third of the reduction overall) and at industrial sites (two-thirds). In 2024, the UK closed its last coal-fired power station, as well as the final blast furnace at the Port Talbot steelworks. Furnaces at Scunthorpe paused operations. Both sites are due to convert to electric-arc furnaces that do not rely on coal.
- Oil demand fell 1.4% despite increased road traffic, largely due to the rise in the number of EVs. The UK’s 1.4m EVs, 0.8m plug-in hybrids and 76,000 electric vans cut oil-related emissions by at least 5.9MtCO2e, Carbon Brief analysis finds, only slightly offset by around 0.5MtCO2e from higher electricity demand.
- The UK’s EV motorists each saved around £800, on average, in 2024 – some £1.7bn in total – relative to the cost of driving petrol or diesel vehicles.
- Gas demand for heating increased, despite warmer average temperatures than in 2023, as prices eased from the peaks seen after the global energy crisis.
- However, gas demand fell overall due to lower gas-fired electricity generation, thanks to higher electricity imports and increased output from low-carbon sources.
The UK would need to cut its emissions by a larger amount each year than it did in 2024, to reach its international climate goal for 2035, as well as its national target to reach net-zero by 2050.
The analysis is the latest in a decade-long series of annual estimates from Carbon Brief, covering emissions during 2023, 2022, 2020, 2019, 2018, 2017, 2016, 2015 and 2014.
Lowest since 1872
The UK’s territorial greenhouse gas emissions – those that occur within the country’s borders – have now fallen in 26 of the 35 years since 1990.
(Consumption-based emissions, including CO2 embedded in imported goods and services, were increasing until 2007, but have since fallen at a similar rate to territorial emissions.)
Apart from brief rebounds after the global financial crisis and the Covid-19 lockdowns, UK emissions have fallen every year for the past two decades.
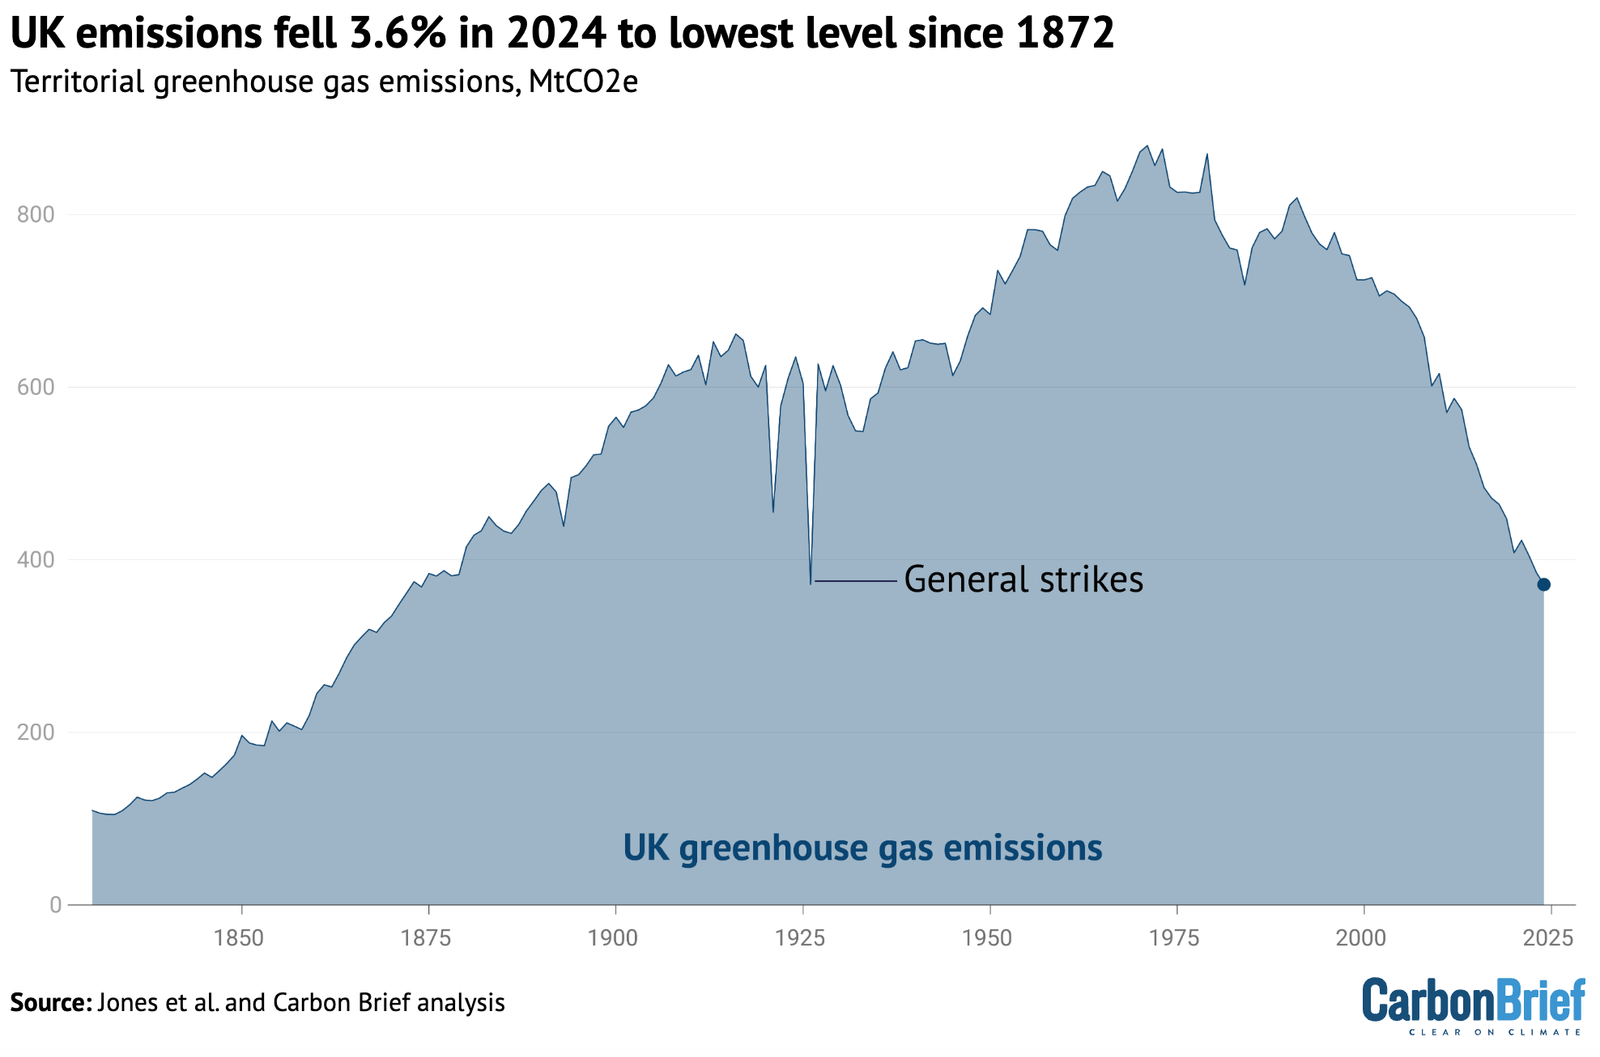
The latest 14MtCO2e (3.6%) reduction takes UK emissions down to 371MtCO2e, according to Carbon Brief’s new analysis.
This is the lowest since 1872 and on par with 1926, when there was a general strike, as shown in the figure below. In 1872, Queen Victoria was on the throne and Wanderers beat Royal Engineers in the first-ever FA Cup final, held at Kennington Oval in south London.

The UK’s emissions are now definitively below the level reached only temporarily during the height of Covid in 2020, having fallen steadily in each of the past three years.
They are now at levels not seen consistently since Victorian times.
Coal collapse
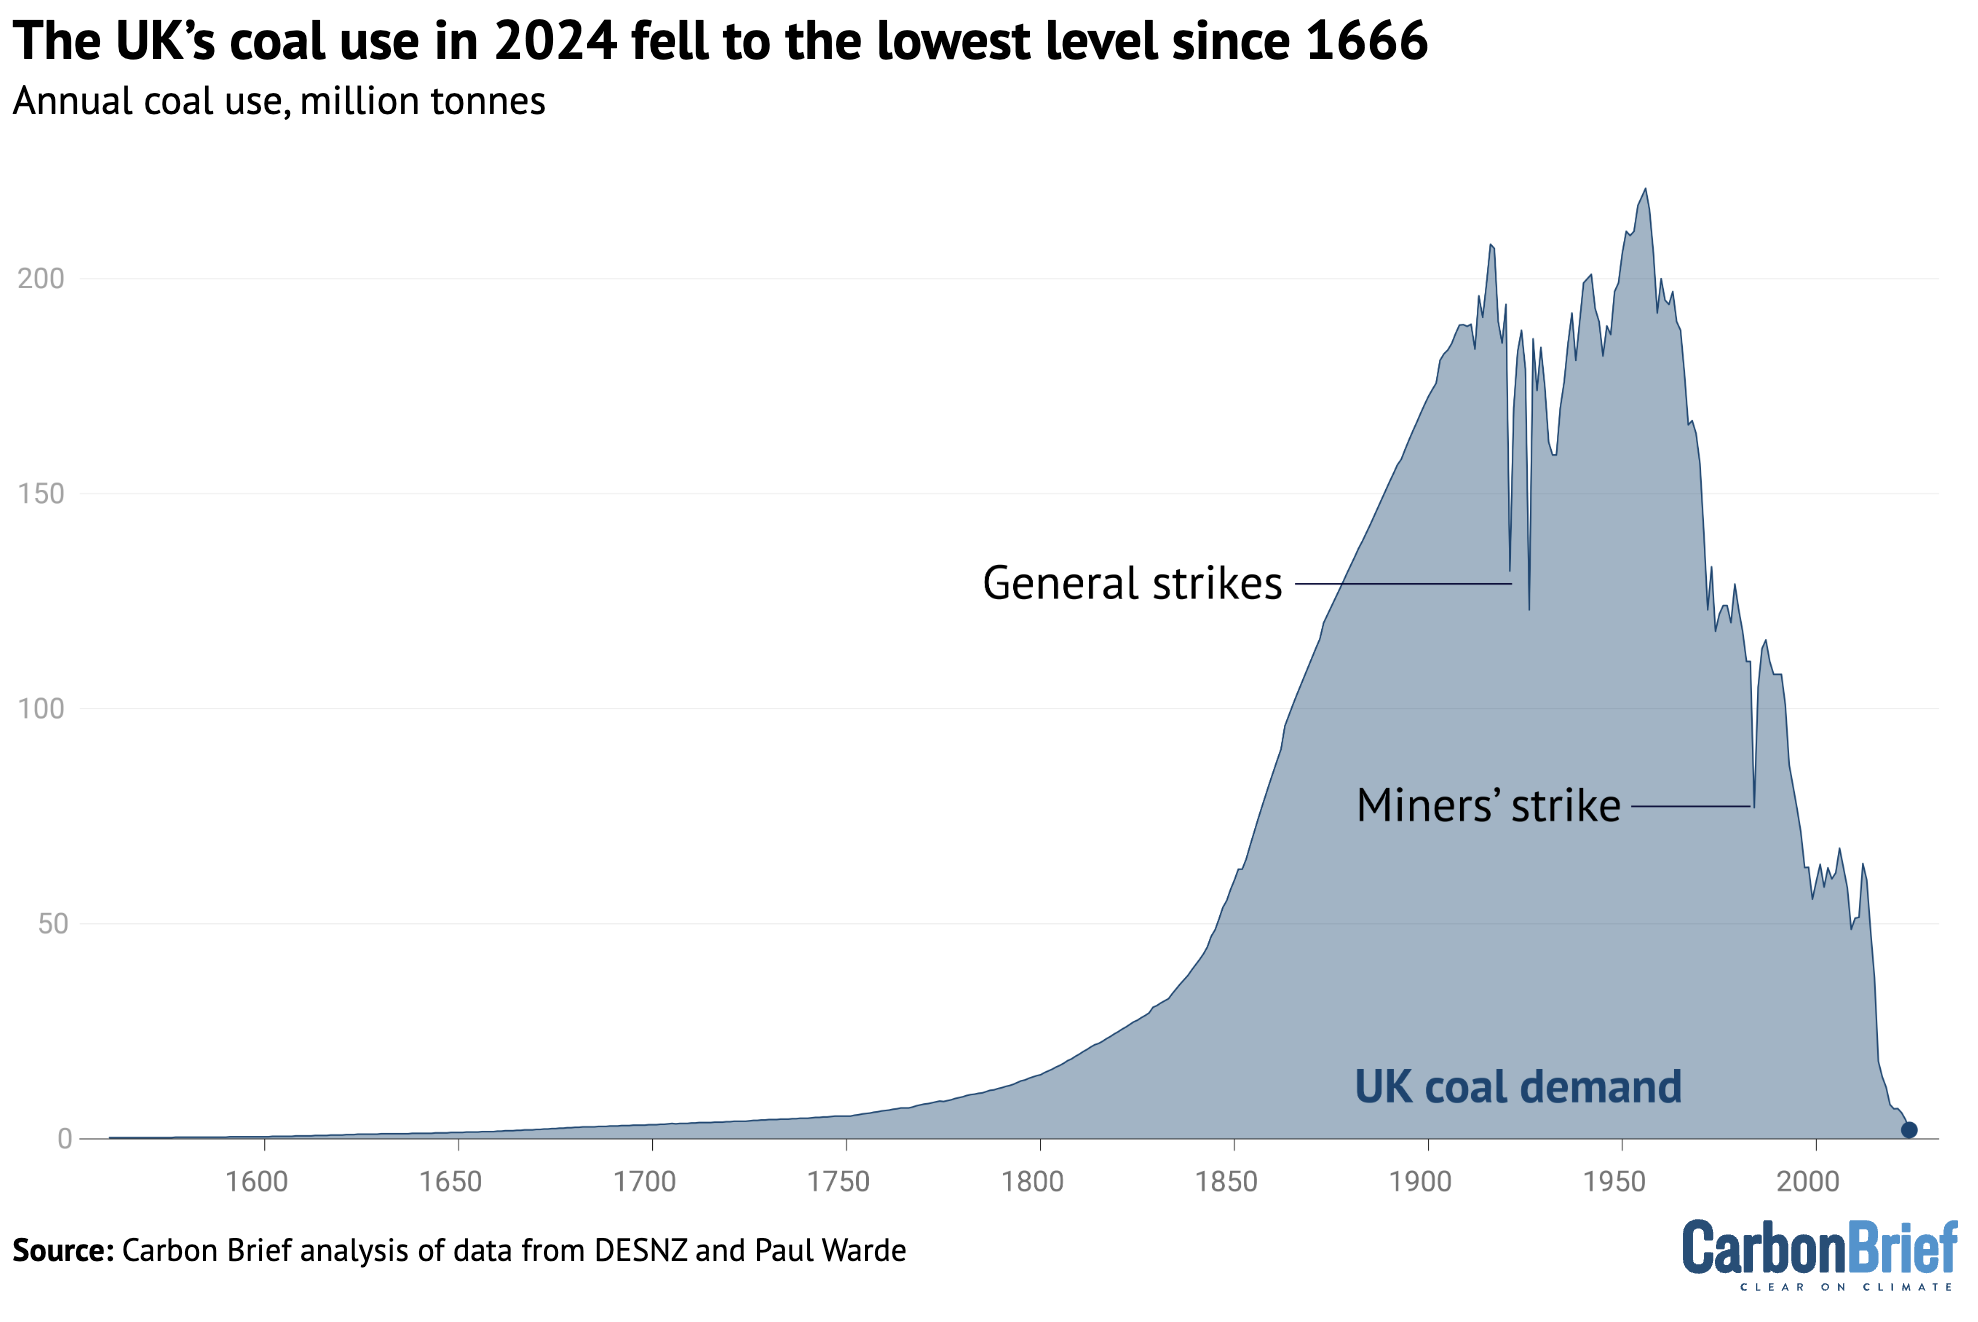
The largest factor in emissions falling last year, accounting for around 7MtCO2e or two-thirds of the reduction overall, was a massive 54% drop in UK coal demand.
In percentage terms, this was the fastest annual reduction in UK coal demand on record, in figures going back to the 16th century. (In absolute terms, the 2.4Mt fall in coal use in 2024 is easily eclipsed by the 34Mt reduction seen during the 1984 miners’ strike.)
The UK used just 2.1Mt of coal in 2024. As shown in the figure below, this is the lowest amount since 1666, when the UK’s capital city was engulfed in the Great Fire of London.
Roughly one-third of the drop in coal use overall last year was due to the closure of the UK’s last coal-fired power station, at Ratcliffe-on-Soar in Nottinghamshire. (For more on how the UK became the first G7 country to phase out coal power, see Carbon Brief’s in-depth interactive feature.)
The plant supplied power to the grid for the last time in September 2024, bringing to an end a 142-year era of using coal to generate electricity in the UK.
The shift away from coal power towards low-carbon sources has been one of the driving forces of UK emissions cuts in recent years.
Indeed, in the period since the UK’s Climate Change Act was passed, the amount of coal used to generate electricity has dropped by 99%, from 48Mt in 2008 to less than 1Mt in 2024. This accounts for the large majority (84%) of the total reduction in coal use over the same period.
Steel slide
In 2024, however, two-thirds of the drop in UK coal consumption – and one-third of the drop in emissions overall – came from lower coal use by heavy industry.
This was largely due to lower steel production, which fell from 5.6Mt in 2023 to 4.0Mt in 2024, a reduction of 29%. This 1.6Mt drop in production was mostly offset by a 1.3Mt increase in imports.
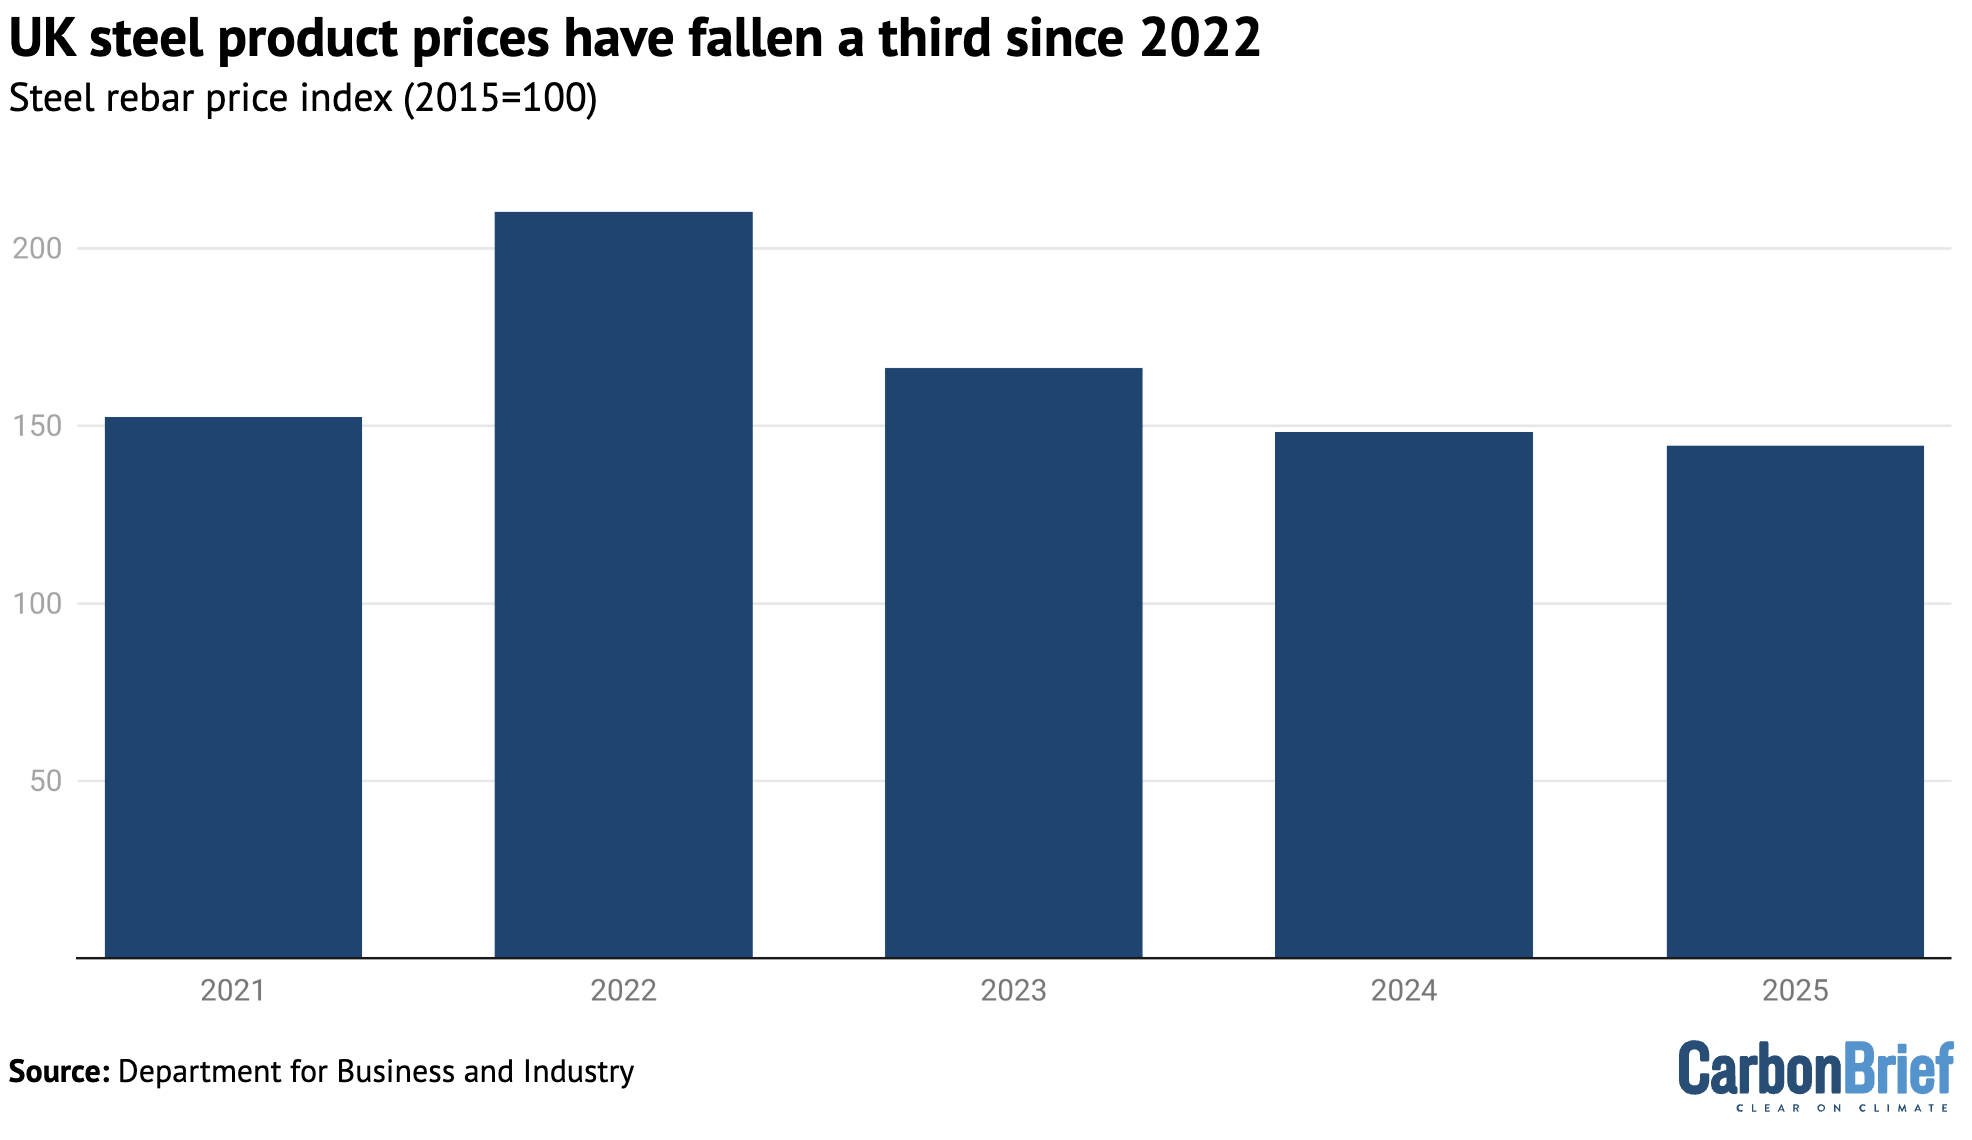
The Port Talbot steelworks in Wales shut down its last two blast furnaces in April and September, with owner Tata blaming losses of £1m a day for the closures.
Since the site last made a profit in 2022, UK and global steel prices have fallen sharply, as shown in the figure below. US credit rating agency Fitch Ratings says the decline in prices, down to weak demand and high exports from China, is “putting pressure on producers’ margins”.
Many commentators have tried to blame climate policy or electricity prices for the steel sector’s problems. However, energy only makes up a tiny fraction of coal-based steel production costs.
Moreover, steelmakers around the world – from China to South Africa – are facing similar challenges, with prices falling as a result of supply being significantly greater than demand.
Industry group Eurofer says the European market is being “flooded by cheap foreign steel”. It adds that economic headwinds in China, including its real-estate slowdown, have seen “around 100m tonnes of Chinese steel…flooding major markets at dumping prices”.
As such, it is not at all clear that the UK steel sector would have fared differently – or that the Port Talbot blast furnaces would have remained open – in the absence of climate policy.
For example, the sector is part of the UK emissions trading scheme (UKETS), meaning it nominally faces a carbon price that imports from outside the EU would not have to pay.
Yet UK (and EU) steelmakers continue to receive free allowances to shield them from the risk of “leakage” due to competition from abroad. The Port Talbot steelworks received more than 21m free allowances to cover its emissions in the period 2021-2025, worth roughly £1bn. Similarly, the Scunthorpe steelworks received nearly 17m allowances worth around £0.8bn.
From 2027, the UK plans to follow the EU in shifting from free allowances to a carbon border adjustment mechanism (CBAM), under which importers must pay an equivalent carbon price.
The closure of the UK’s blast furnaces is not the end of the story for steelmaking in the country. Indeed, Tata has pledged an investment worth £1.25bn to reopen its Welsh site with electric arc furnaces, which do not rely on coal. This includes up to £0.5bn from the government. Tata says it will have the capacity to produce 3Mt of steel per year from late 2027 or early 2028.
Production also paused in 2024 at the Scunthorpe steelworks, run by the Chinese-owned British Steel, reportedly due to managers ordering the wrong type of coal. Its blast furnaces are now operating again, but it is also looking to shift to electric arc furnaces with government support.
The UK steel industry has welcomed the shift to electric arc furnaces, but has called for efforts to reduce electricity prices, including the 2024 “supercharger” scheme that exempts heavy industry from additional costs relating to renewable subsidies and electricity network charges.
The government’s February 2025 steel strategy looks at issues including “overcapacity in global markets” and the “influence of electricity prices on the competitiveness of the steel sector”.
Rise of EVs
After coal, the next-largest chunk of emissions cuts in 2024 came from lower demand for oil and gas, which accounted for around a third of the reduction overall.
The 1.4% drop in oil demand is particularly interesting, given that traffic on the UK’s roads has been increasing in recent years.
The number of miles driven on UK roads increased by more than 1% in 2024 and is now close to pre-pandemic levels. Yet UK demand for road-transport fuels fell by another 1.6% in 2024 and is now nearly 14% lower than it was in 2019, as shown in the figure below.
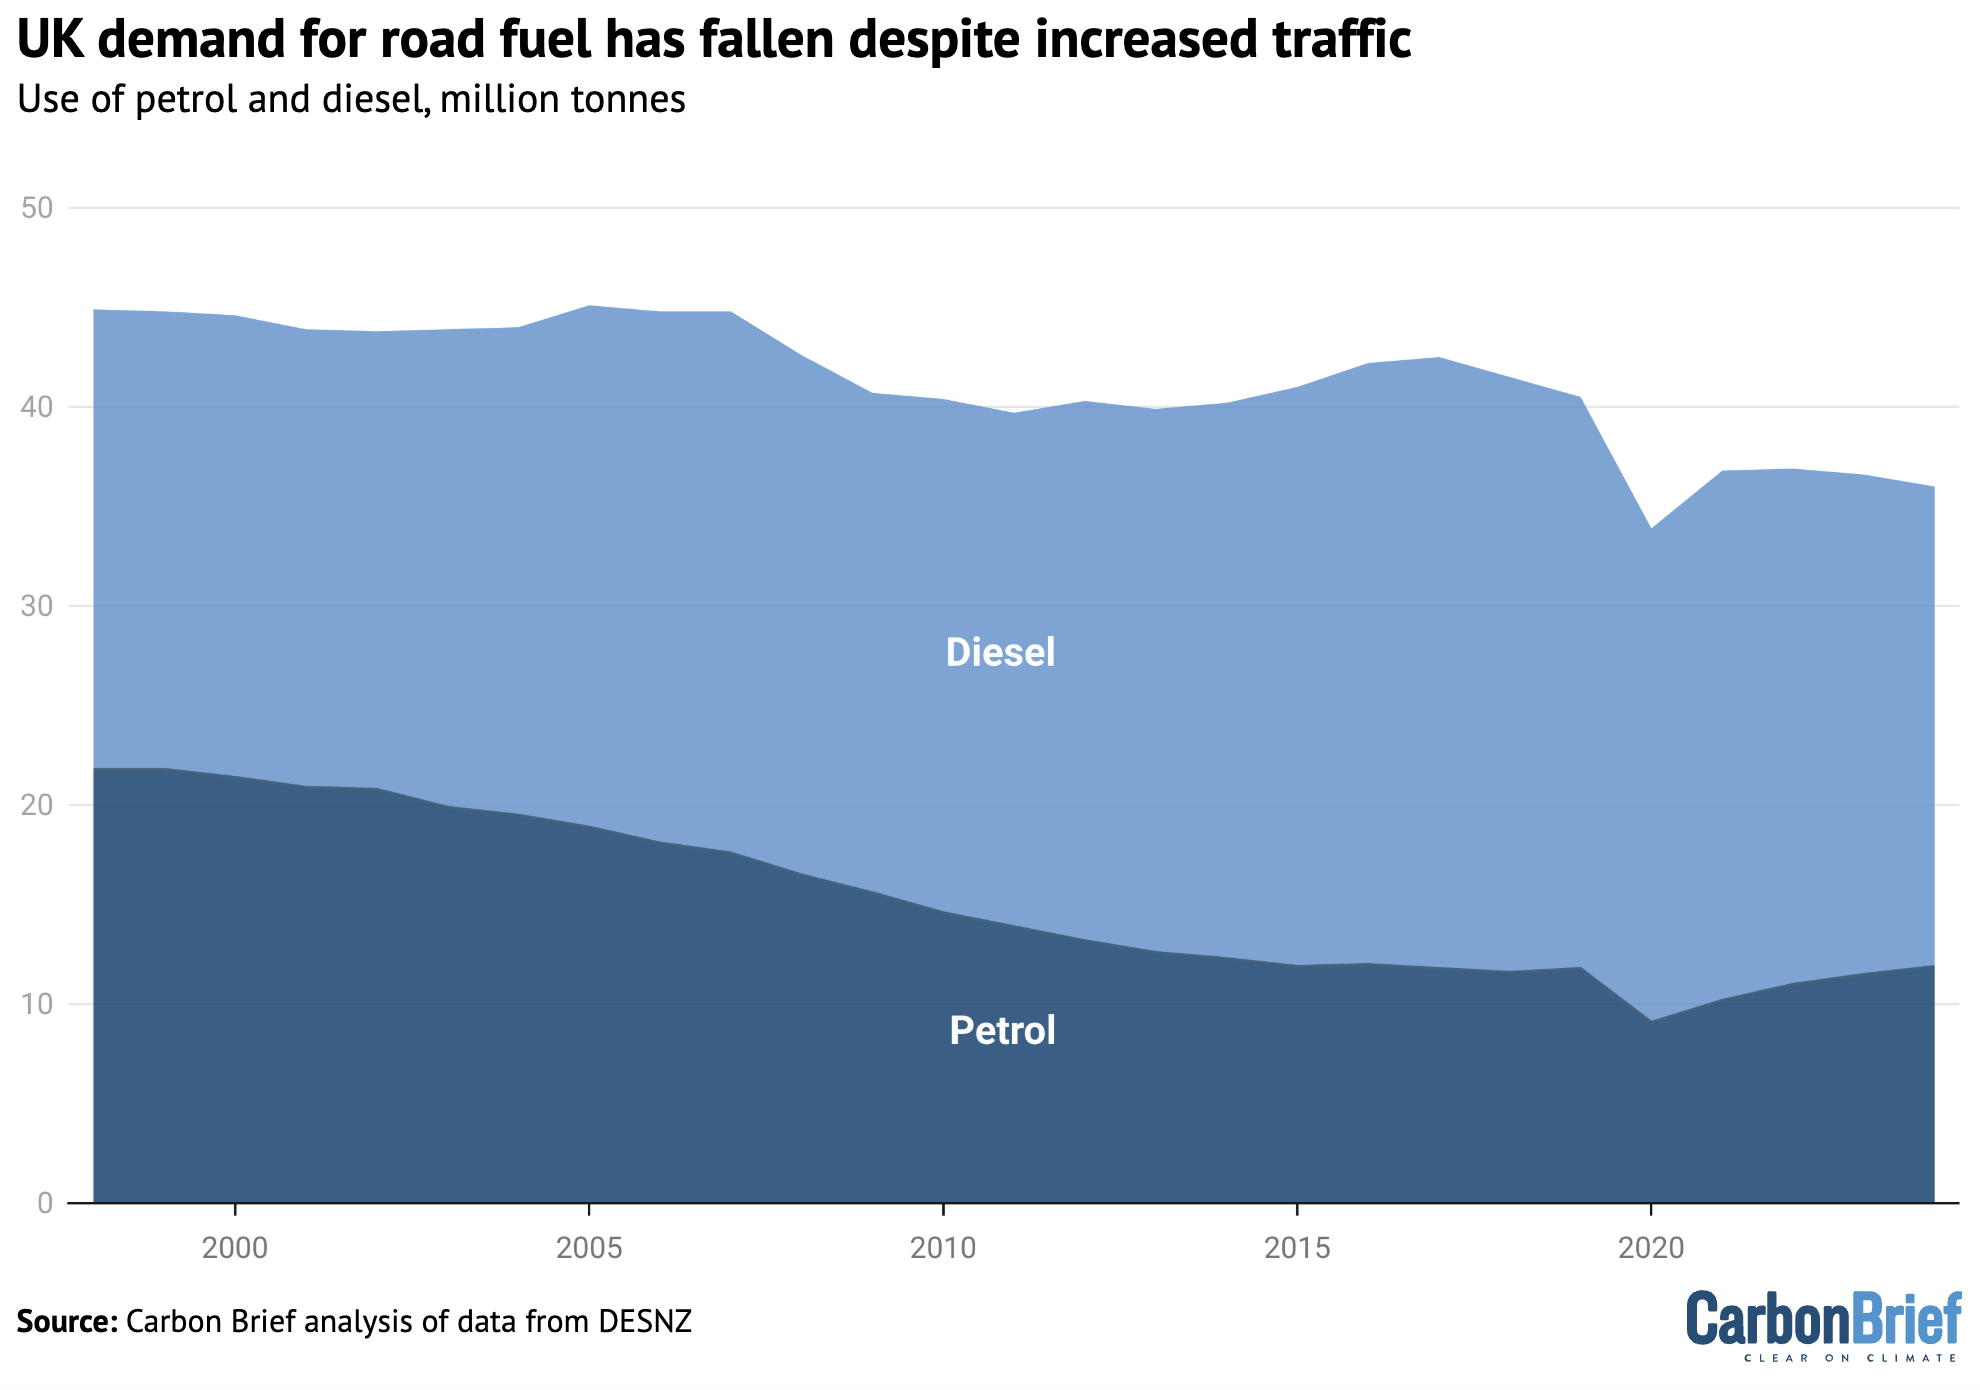
Along with improvements in fuel efficiency, the rise of EVs is a key part of this phenomenon.
The UK’s right-leaning newspapers have been busy finding new driving-related wordplay for what they have misleadingly described as a “stalling” market for EVs, which is apparently “going into reverse”.
The reality is that the number of EVs on the UK’s road rose from 1m in 2023 to 1.4m in 2024, an increase of 39% in just one year. The number of plug-in hybrids was up 28% to 0.8m.
Along with 76,000 electric vans, these EVs cut oil-related emissions by at least 5.9MtCO2e in 2024, Carbon Brief analysis finds, relative to similar vehicles burning petrol or diesel fuel.
These electrified vehicles have added around 4 terawatt hours to UK electricity demand in 2024, around 1% of the total. As such, the emissions associated with additional electricity generation, at around 0.5MtCO2e, offsets less than 10% of the savings from reduced oil use.
(On a lifecycle basis, EVs in the UK cut emissions by around 70% taking into account the emissions associated with manufacturing the cars, their batteries and fuelling them during use.)
Even more strikingly, the UK’s EV drivers saved around £1.7bn in lower fuel costs in 2024, Carbon Brief analysis finds, relative to petrol or diesel vehicles.
These savings, averaging roughly £800 per vehicle per year, conservatively assume that charging takes place at domestic retail electricity prices, rather than reduced-rate overnight tariffs.
Greenhouse gas emissions from burning gas also dipped in 2024, as demand for the fuel reached a record low. The roughly 2MtCO2e drop in emissions from gas made up around a sixth of the reduction in the UK overall and reflects the combined impact of competing trends.
Demand for heating in buildings (+3.8%) and offices (+0.6%) increased, despite temperatures being above average and higher than a year earlier. Industrial gas use also increased (+0.3%).
This is likely the result of lower fuel prices, which have eased since the peaks seen during the early phase of the global energy crisis precipitated by Russia’s invasion of Ukraine in 2022.
In contrast, gas demand for generating power fell by 13%, helping to make the UK’s electricity in 2024 the “cleanest ever”. This reduction was due to an increase in output from low-carbon sources, as well as an increase in the amount of cheap electricity imported from overseas.
A small, but still notable contributor to lower UK gas demand in 2024 came from reduced imports of liquified natural gas (LNG), which roughly halved compared with a year earlier.
Following Russia’s invasion, the UK had acted as an import hub for the rest of Europe, taking deliveries of LNG and then re-exporting the gas to the continent via pipelines. In 2024, however, European demand for gas eased and UK exports via the pipeline to Belgium also halved.
Import terminals use some of the gas they handle to “regasify” the supercooled LNG cargo that arrives by ship, turning it back into a gas that can be fed into pipelines. (The emissions associated with this process count towards the UK’s territorial total, even if the gas is burned overseas.)
In 2023, these terminals had used some 3TWh of gas, equivalent to the heating needs of half the homes in Birmingham. In 2024, LNG terminals used half this amount.
Emissions decoupling
While the UK’s emissions have fallen in most years since 1990, the baseline for the nation’s climate goals, the size of its economy has nearly doubled.
Specifically, emissions are “decoupling” from economic growth, having fallen to 54% below 1990 levels while GDP is up 84%, as shown in the figure below.
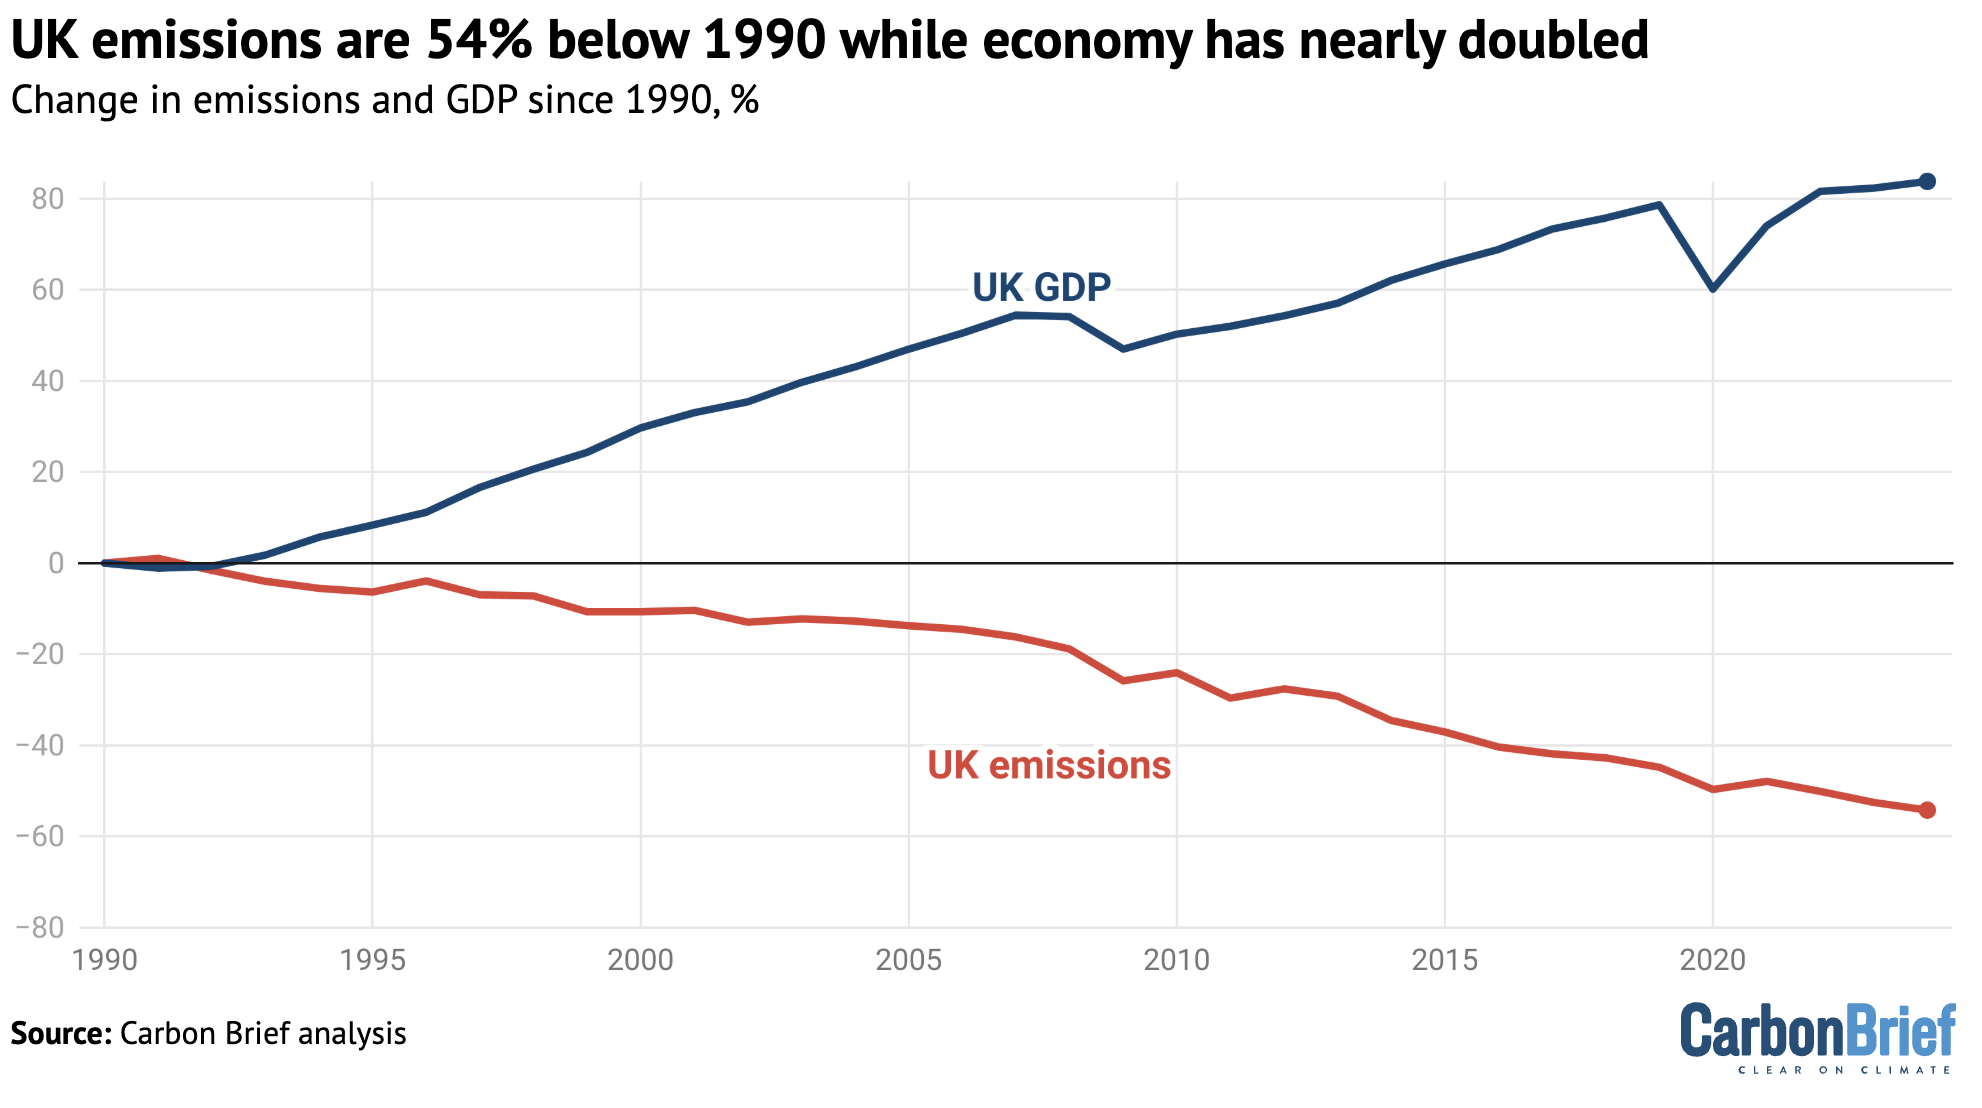
Taking an even longer view, the UK’s £2tn economy is now about 20 times larger than it was in 1872, after adjusting for inflation, whereas emissions are roughly the same.
Moreover, considering its population is now nearly 70 million people compared to 32m in 1872, the UK’s per-capita emissions have fallen two-fold, from 11.3tCO2e in 1872 to 5.4CO2e in 2024.
The 14MtCO2e drop in emissions in 2024 can be compared with the trajectory needed to reach the UK’s national and international climate pledges for 2035 and 2050.
If emissions fell by the same amount every year as they did in 2024, then the UK would miss both targets. It would need to cut emissions by 20MtCO2e each year to meet the 2035 target and by an average of 15MtCO2e per year to reach net-zero emissions by 2050.
In other words, annual emissions cuts would need to accelerate in the short- to medium-term, but could start to ease off later on. This is consistent with the cost-effective pathway to net-zero set out last month by the Climate Change Committee in its latest advice to the government.
Methodology
The starting point for Carbon Brief’s analysis of UK greenhouse gas emissions is preliminary government estimates of energy use by fuel. These are published quarterly, with the final quarter of each year appearing in figures published at the end of the following February. The same approach has accurately estimated year-to-year changes in emissions in previous years (see table, below).
| Year | Reported | Carbon Brief | Difference |
|---|---|---|---|
| 2010 | 2.4 | 2.6 | 0.2 |
| 2011 | -7.3 | -7.7 | -0.4 |
| 2012 | 2.9 | 3.6 | 0.7 |
| 2013 | -2.2 | -4.1 | -1.9 |
| 2014 | -7.5 | -7.5 | -0.0 |
| 2015 | -3.9 | -3.8 | 0.0 |
| 2016 | -5.2 | -5.7 | -0.4 |
| 2017 | -2.5 | -2.0 | 0.5 |
| 2018 | -1.5 | -1.8 | -0.3 |
| 2019 | -3.6 | -4.0 | -0.4 |
| 2020 | -8.8 | -8.9 | -0.0 |
| 2021 | 3.6 | 3.8 | 0.2 |
| 2022 | -4.2 | -3.5 | 0.7 |
| 2023 | -4.9 | -5.1 | -0.2 |
| 2024 | -3.6 |
Annual change in UK greenhouse gas emissions, %
One large source of uncertainty is the provisional energy use data, which is revised at the end of March each year and often again later on. Emissions data is also subject to revision in light of improvements in data collection and the methodology used, with major revisions in 2021.
The table above applies Carbon Brief’s emissions calculations to the comparable energy use and emissions figures, which may differ from those published previously.
Another source of uncertainty is the fact that Carbon Brief’s approach to estimating the annual change in emissions differs from the methodology used for the government’s own provisional estimates. The government has access to more granular data not available for public use.
Carbon Brief’s analysis takes figures on the amount of energy sourced from coal, oil and gas reported in Energy Trends 1.2. These figures are combined with conversion factors for the CO2 emissions per unit of energy, published annually by the UK government. Conversion factors are available for each fuel type, for example, petrol, diesel, gas and coal for electricity generation.
For oil, the analysis also draws on Energy Trends 3.13, which further breaks down demand according to the subtype of oil, for example, petrol, jet fuel and so on. Similarly, for coal, the analysis draws on Energy Trends 2.6, which breaks down solid fuel use by subtype.
Emissions from each fuel are then estimated from the energy use multiplied by the conversion factor, weighted by the relative proportions for each fuel subtype.
For example, the UK uses roughly 50m tonnes of oil equivalent (Mtoe) in the form of oil products, around half of which is from road diesel. So half the total energy use from oil is combined with the conversion factor for road diesel, another one-fifth for petrol and so on.
Energy use from each fossil fuel subtype is mapped onto the appropriate emissions conversion factor. In some cases, there is no direct read-across, in which case the nearest appropriate substitute is used. For example, energy use listed as “bitumen” is mapped to “processed fuel oils – residual oil”. Similarly, solid fuel used by “other conversion industries” is mapped to “petroleum coke”, and “other” solid fuel use is mapped to “coal (domestic)”.
The energy use figures are calculated on an inland consumption basis, meaning they include bunkers consumed in the UK for international transport by air and sea. In contrast, national emissions inventories exclude international aviation and shipping.
The analysis, therefore, estimates and removes the part of oil use that is due to the UK’s share of international aviation. It draws on the UK’s final greenhouse gas emissions inventory, which breaks emissions down by sector and reports the total for domestic aviation.
This domestic emissions figure is compared with the estimated emissions due to jet fuel use overall, based on the appropriate conversion factor. The analysis assumes that domestic aviation’s share of emissions is equivalent to its share of jet fuel energy use.
In addition to estimating CO2 emissions from fossil fuel use, Carbon Brief assumes that CO2 emissions from non-fuel sources, such as land-use change and forestry, are the same as a year earlier. The remaining greenhouse gas emissions are assumed to change in line with the latest government energy and emissions projections.
These assumptions are based on the UK government’s own methodology for preliminary greenhouse gas emissions estimates, published in 2019.
Note that the figures in this article are for emissions within the UK measured according to international guidelines. This means they exclude emissions associated with imported goods, including imported biomass, as well as the UK’s share of international aviation and shipping.
The Office for National Statistics (ONS) has published detailed comparisons between various different approaches to calculating UK emissions, on a territorial, consumption, environmental accounts or international accounting basis.
The UK’s consumption-based CO2 emissions increased between 1990 and 2007. Since then, however, they have fallen by a similar number of tonnes as emissions within the UK.
Bioenergy is a significant source of renewable energy in the UK and its climate benefits are disputed. Contrary to public perception, however, only around one-quarter of bioenergy is imported.
International aviation is considered part of the UK’s carbon budgets and faces the prospect of tighter limits on its CO2 emissions. The international shipping sector has a target to at least halve its emissions by 2050, relative to 2008 levels.

The post Analysis: UK emissions fall 3.6% in 2024 as coal use drops to lowest since 1666 appeared first on Carbon Brief.