The UK’s electricity was the cleanest ever in 2024, new Carbon Brief analysis shows, with carbon dioxide (CO2) emissions per unit falling by more than two-thirds in a decade.
This is because the UK has phased out coal and is now getting less than half as much electricity from burning fossil fuels as a decade ago, while renewable generation has more than doubled.
In total, fossil fuels made up just 29% of the UK’s electricity in 2024 – the lowest level on record – while renewables reached a record-high 45% and nuclear was another 13%.
As a result, each unit of electricity generated in 2024 was associated with an average of just 124g of CO2, compared with a “carbon intensity” of 419gCO2 per kilowatt hour (kWh) in 2014.
Other key insights from the data include:
- In 2024, the country generated just 91 terawatt hours (TWh) of electricity from fossil fuels – mainly gas, as coal was phased out in September – down from 203TWh in 2014 (-55%).
- Renewable sources more than doubled from 65TWh in 2014 to 143TWh in 2024 (+122%).
- Gas-fired power stations remained the UK’s single-largest source of electricity in 2024, generating some 88TWh (28%), just ahead of wind at 84TWh (26%).
- The remaining sources of electricity in 2024 were nuclear (41TWh, 13%), biomass (40TWh, 13%), imports (33TWh, 11%) and solar (14TWh, 4%).
- Some 58% of electricity – or 64% excluding imports – came from clean sources, both records, but a long way off the government’s target of at least 95% clean power by 2030.
- The emissions associated with UK electricity supplies has fallen from 150m tonnes of CO2 (MtCO2) in 2014 to below 40MtCO2 in 2024, down 74%.
- The reduction in the carbon intensity of electricity means that an electric vehicle (EV) now has lifecycle CO2 savings of 70% over a petrol car, up from only 50% in 2014.
- Similarly, a household using a heat pump instead of a gas boiler is now cutting its heat-related CO2 emissions by 84% per year, rather than only 45% in 2014.
While figures from the National Energy System Operator (NESO) show wind having generated more electricity than gas in 2024, these numbers exclude significant amounts of gas generation, particularly from “combined heat and power” units at industrial sites.
When accounting for all plants burning gas for power in the UK, the fuel remained as the single-largest source of electricity in 2024, slightly ahead of wind.
However, increasing wind power capacity as new projects are completed in the coming months – and below-average wind speeds in 2024 – mean wind is likely to generate more electricity than gas in 2025.
Carbon Brief has published an annual analysis of the UK’s electricity generation in 2023, 2021, 2019, 2018, 2017 and 2016.
Cleanest ever
Having risen to global dominance on the back of coal-fired industrial might, the UK has made significant progress in cleaning up its power supplies over the past 75 years.
It opened the world’s first civil nuclear power plant in the 1950s, burned oil to generate electricity in the 1960s, made a “dash for gas” in the 1990s, and built renewables in the 2000s and 2010s.
In addition, electricity demand has been falling for nearly two decades, as appliances have become more efficient and the economy has shifted away from heavy industry.
These shifts culminated in the closure of the UK’s last coal-fired power station, at Ratcliffe-on-Soar in Nottinghamshire, in September of 2024. This ended a 142-year era of burning the fuel for electricity, and made the UK the first country in the G7 to completely phase out coal power.
The end of coal power, combined with the rise of renewables, means the UK’s electricity was the cleanest ever in 2024, as shown in the figure below.
Specifically, the carbon intensity of electricity fell to just 124gCO2/kWh in 2024. This is 70% lower than it was in 2014 when each unit of electricity was associated with 419gCO2/kWh.
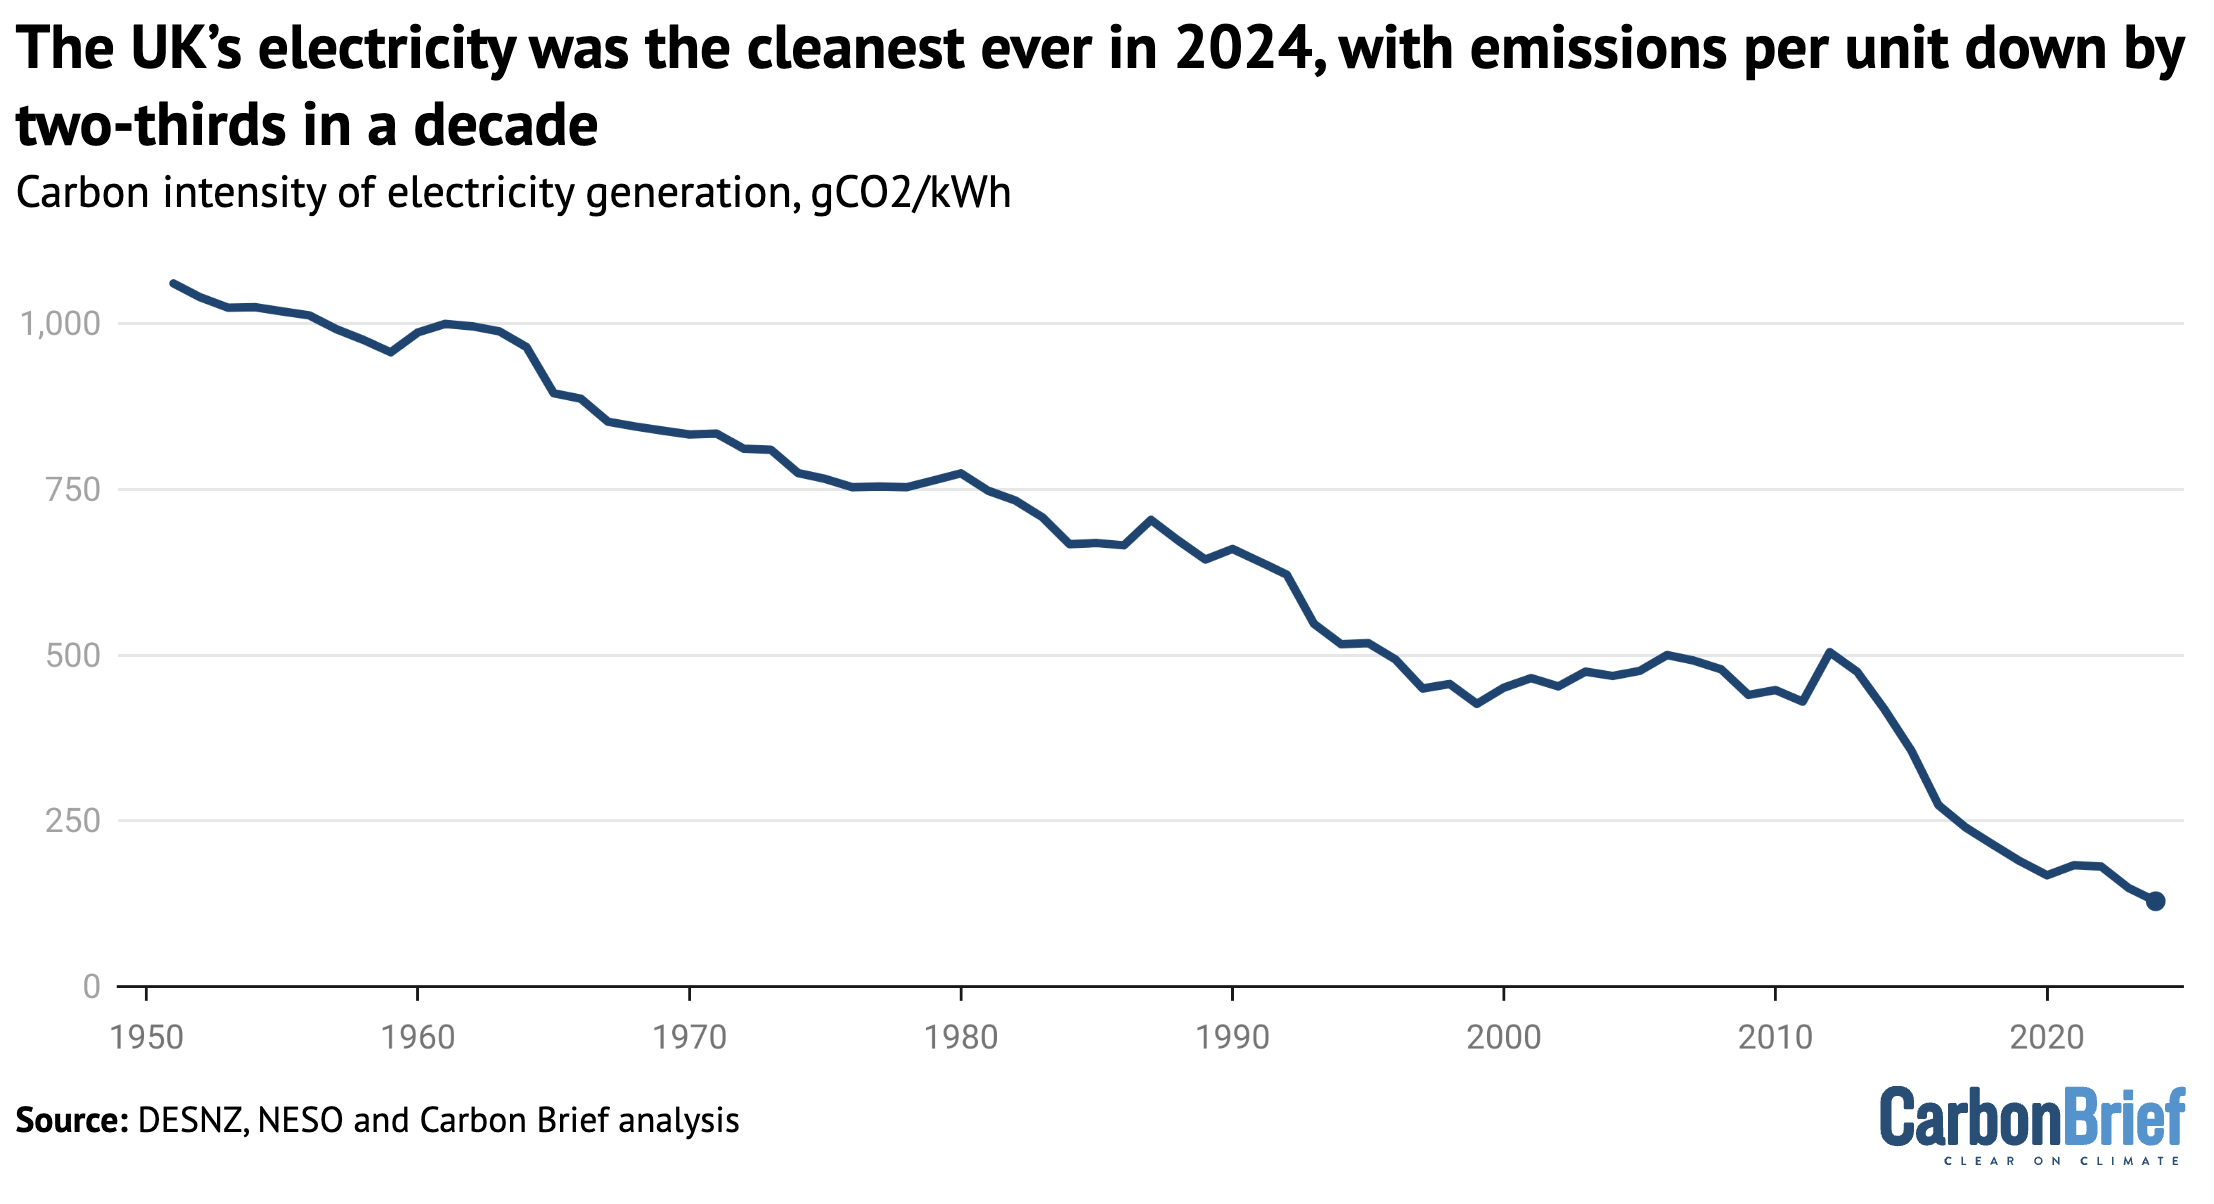
Combined with a reduction in demand, the emissions associated with UK electricity supplies have dropped from 150MtCO2 in 2014 to less than 40MtCO2 in 2024, a reduction of 74%. This includes emissions embedded in imported electricity and lifecycle emissions associated with imported biomass.
Under the government’s target for clean power by 2030, the carbon intensity of electricity generation should fall by another two-thirds by the end of the decade, according to NESO.
In its advice on how to reach the target, NESO set out pathways to clean power by 2030 that would see carbon intensity falling to 50gCO2/kWh or lower, depending on how it is measured.
This will be a very significant challenge. Nevertheless, the power sector has already been transformed over the past decade. It was the UK’s largest source of CO2 until 2014 and is now only the fifth largest, after transport, buildings, industry and agriculture.
Fossil fuel decline
The swift reductions in the carbon intensity of UK electricity are due to a rapid shift away from burning fossil fuels to generate power.
In addition to phasing out coal power, the UK has also seen significant reductions in the amount of gas generation over the past decade, while oil-fired electricity generation is negligible.
In total, fossil-fired power generation has fallen by more than half in the past decade. It has dropped from 203TWh in 2014 to 91TWh in 2024 (-55%), reaching the lowest level since 1955.
This reduction is illustrated in the figure below, which shows how the decline of fossil fuel generation has mainly been offset by the rise of renewables.
Combined electricity generation from wind, biomass, solar and hydro has more than doubled from 65TWh in 2014 to 143TWh in 2024 (+122%). Combined with falls for coal and gas, this means that renewables now generate significantly (57%) more electricity in the UK than fossil fuels.
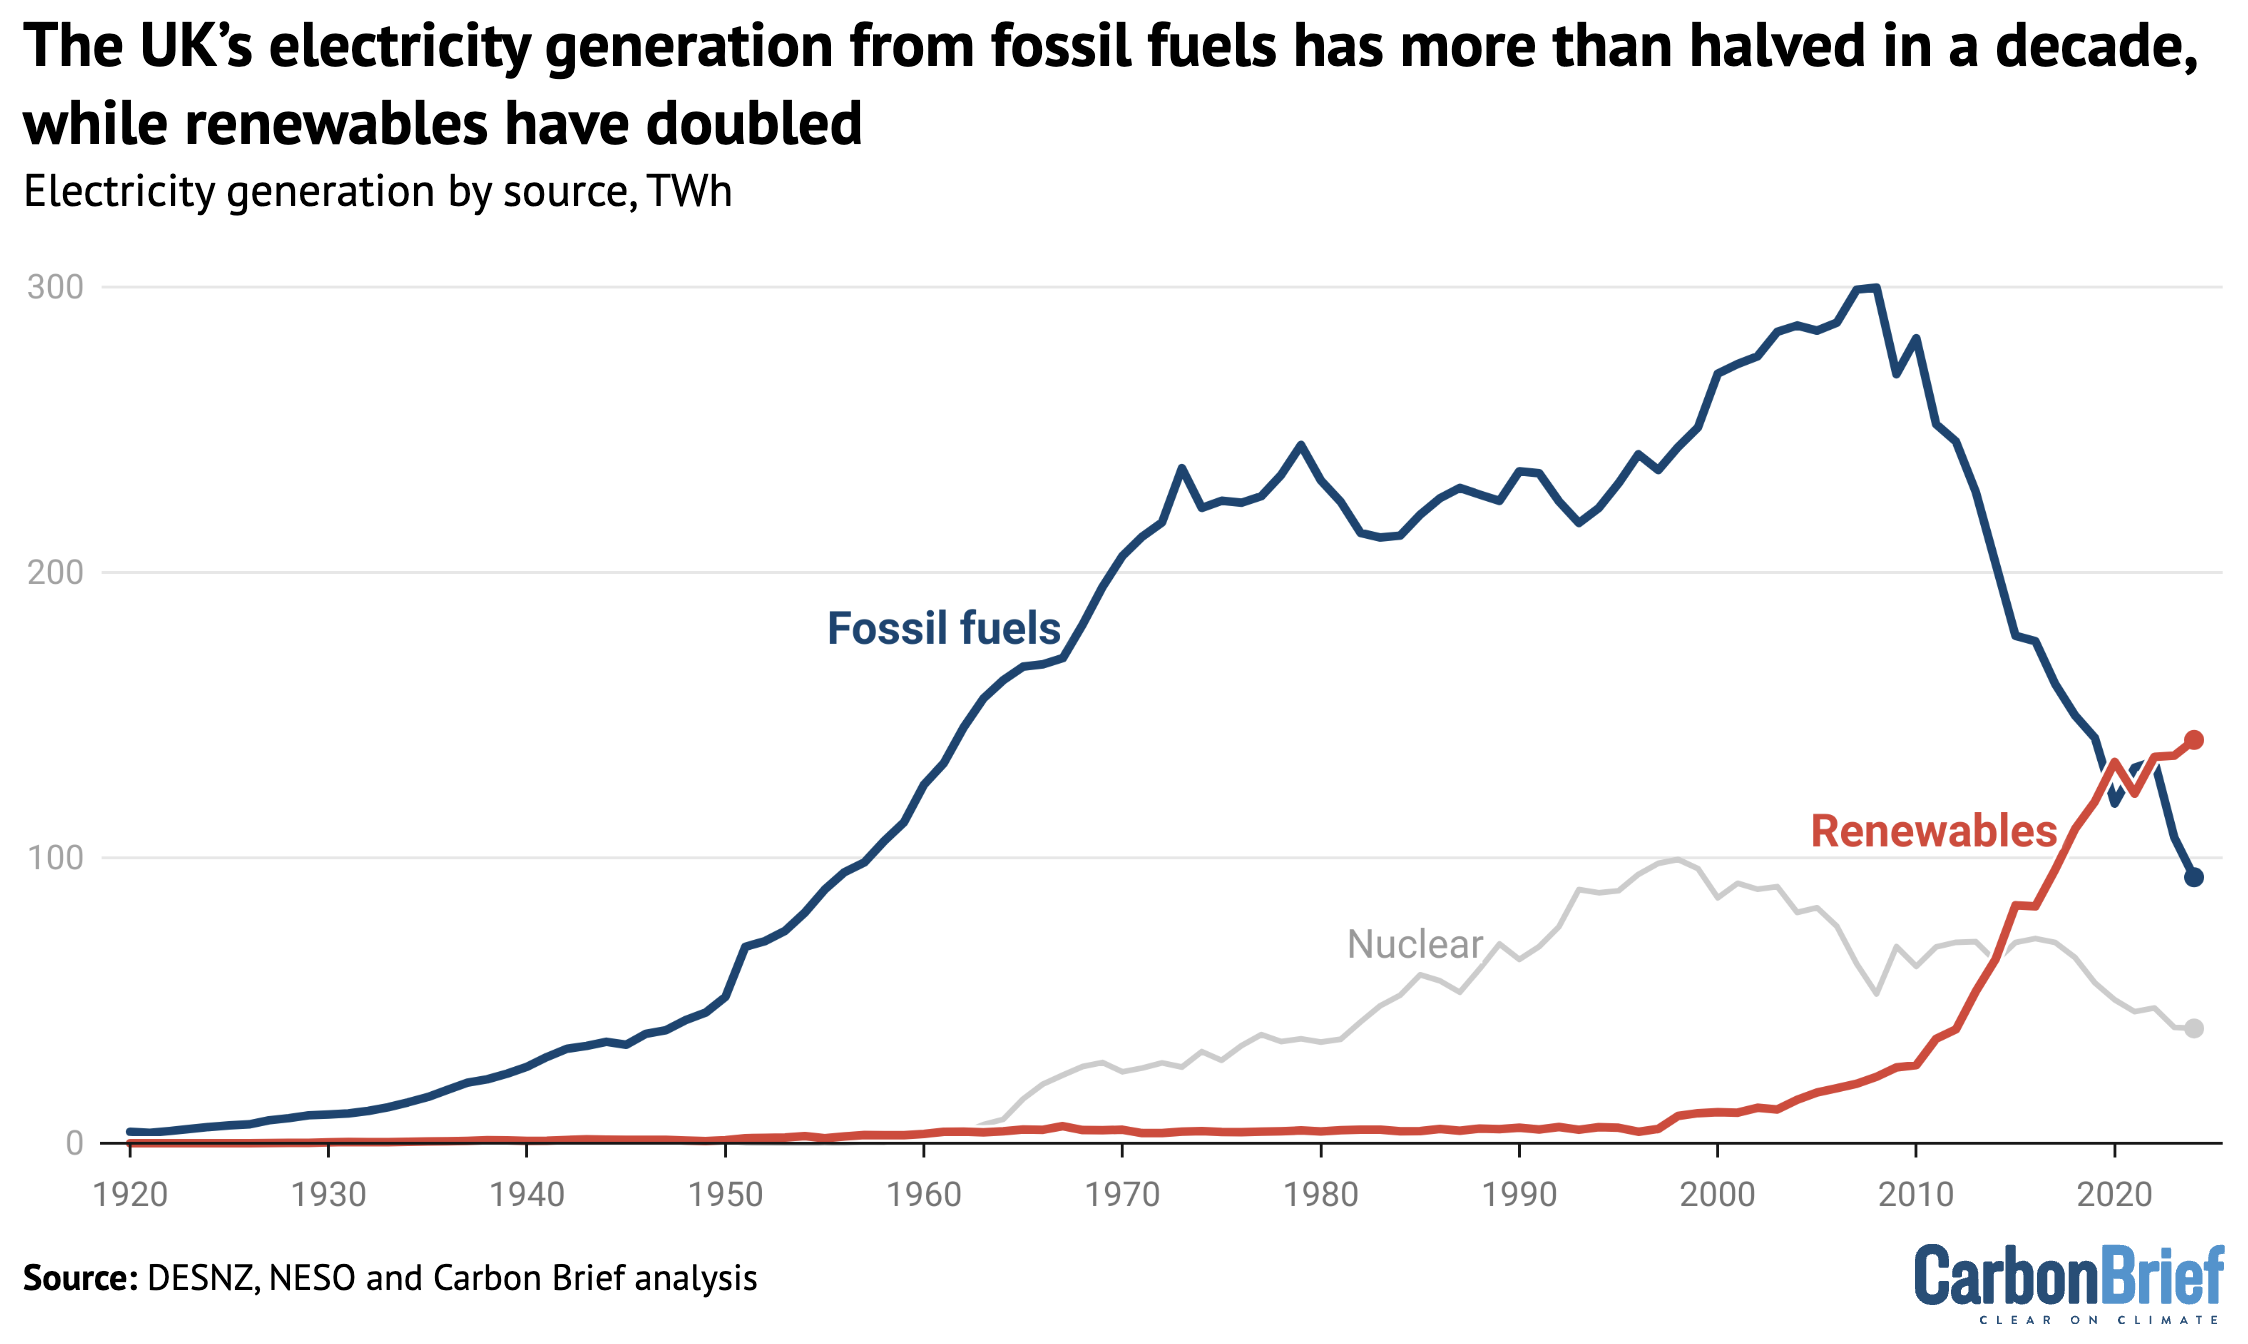
Notably, the carbon intensity of electricity did not fall during the 2000s, because nuclear generation was starting to decline as the nation’s oldest reactors closed down.
With renewables only just starting to ramp up in this period, the country turned back to fossil fuels to replace lost nuclear generation.
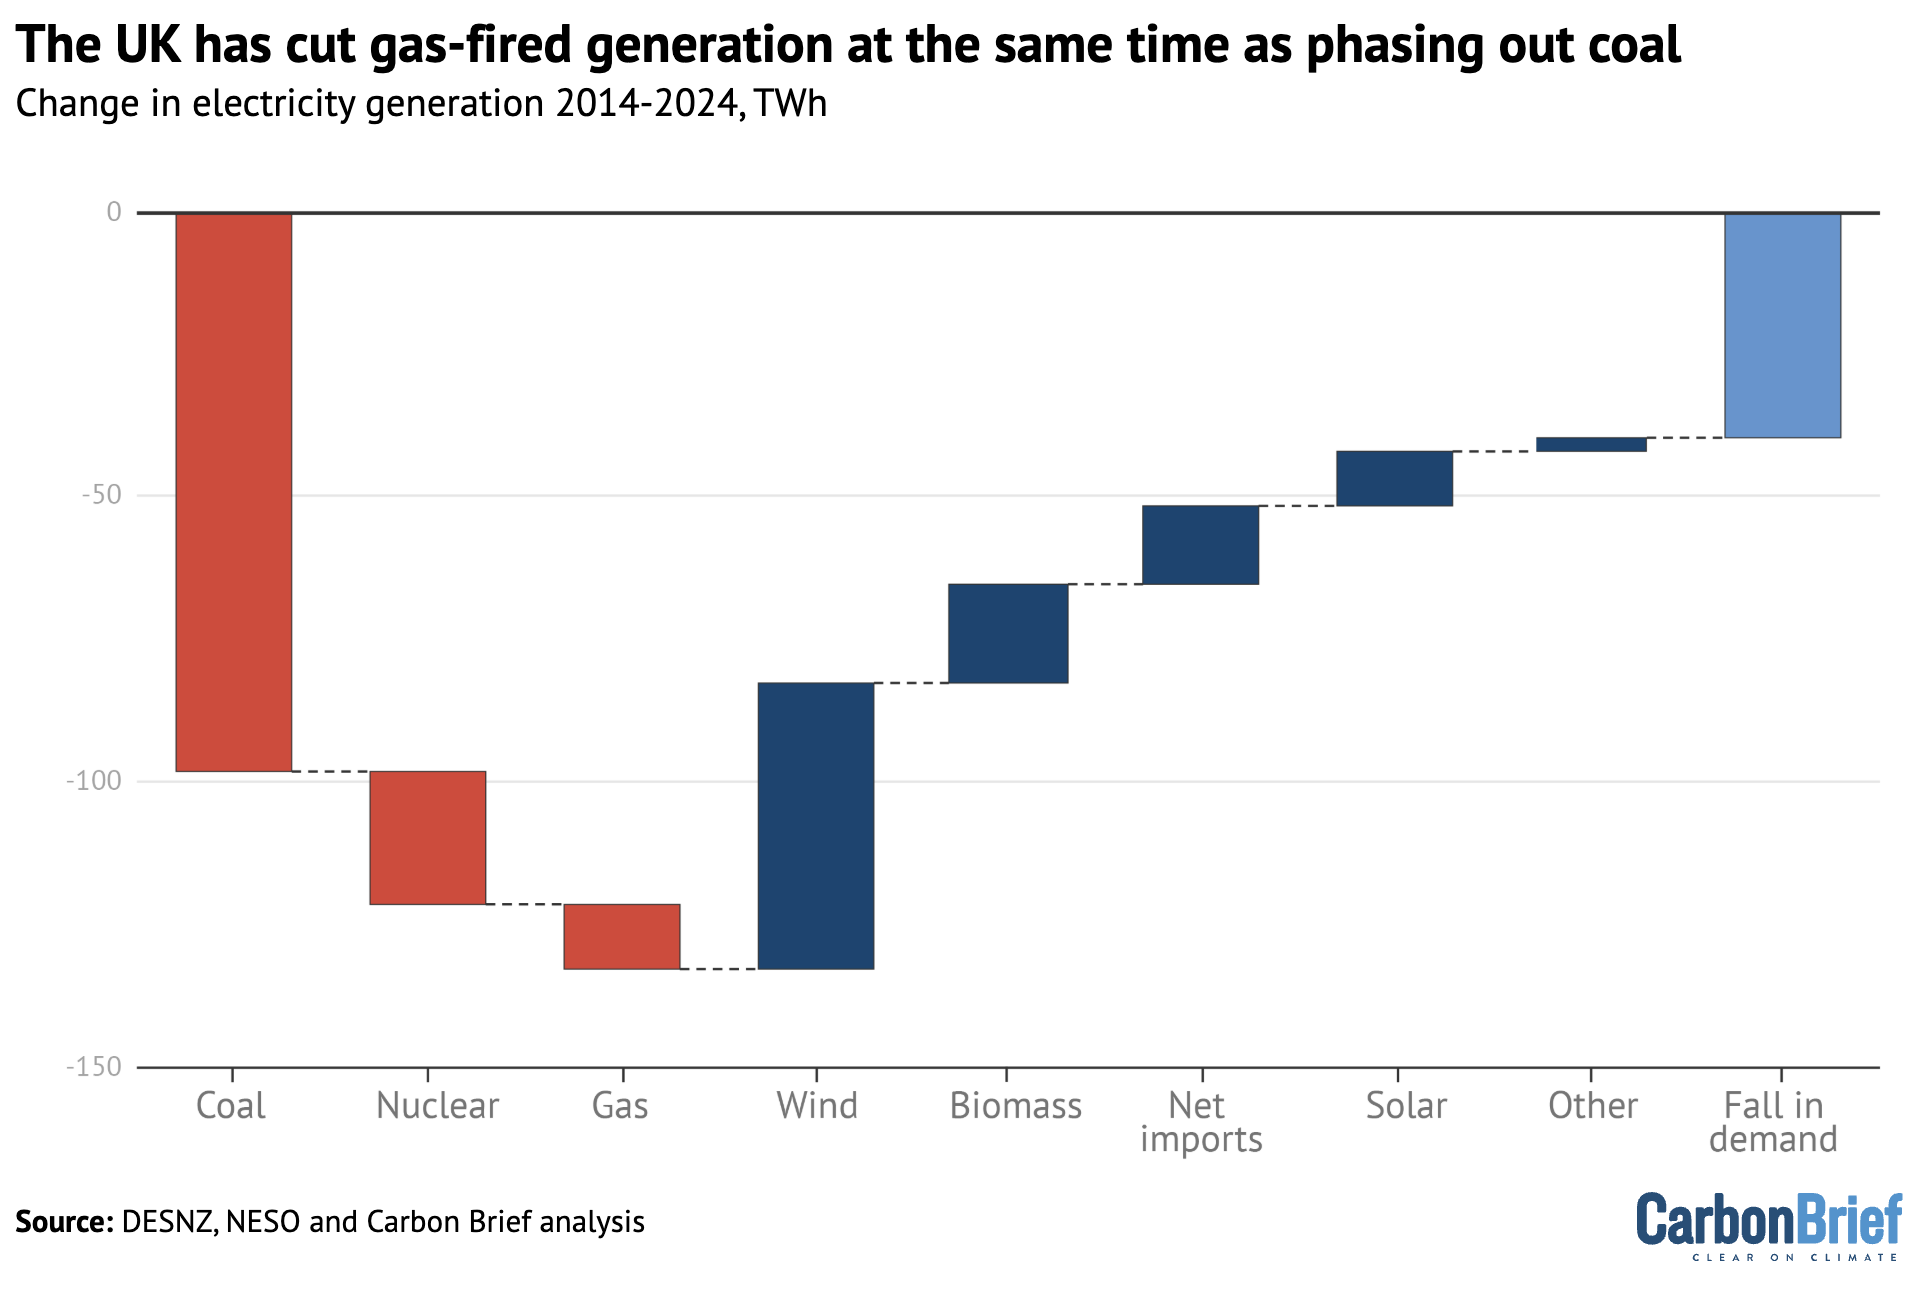
In contrast, carbon intensity has fallen rapidly since 2014, despite further nuclear retirements. Nuclear decline and the coal phase out have been more than offset by renewables, imports and falling demand, meaning gas use has also dropped, as shown in the figure below.
While looking ahead to 2030 and beyond, electricity demand is expected to rise as transport and heat are increasingly electrified via EVs and heat pumps (see below).
According to NESO’s recent advice on reaching clean power by 2030, demand for electricity is expected to grow 11% by 2030 and to nearly double by 2050.
Wind powered
Wind has seen the largest increase of any power source in the UK over the past decade. Moreover, it is expected to form the backbone of the nation’s electricity system by 2030.
The rise of wind power and the decline of fossil fuels means that the UK now gets nearly as much electricity from wind as from gas, as shown in the figure below.
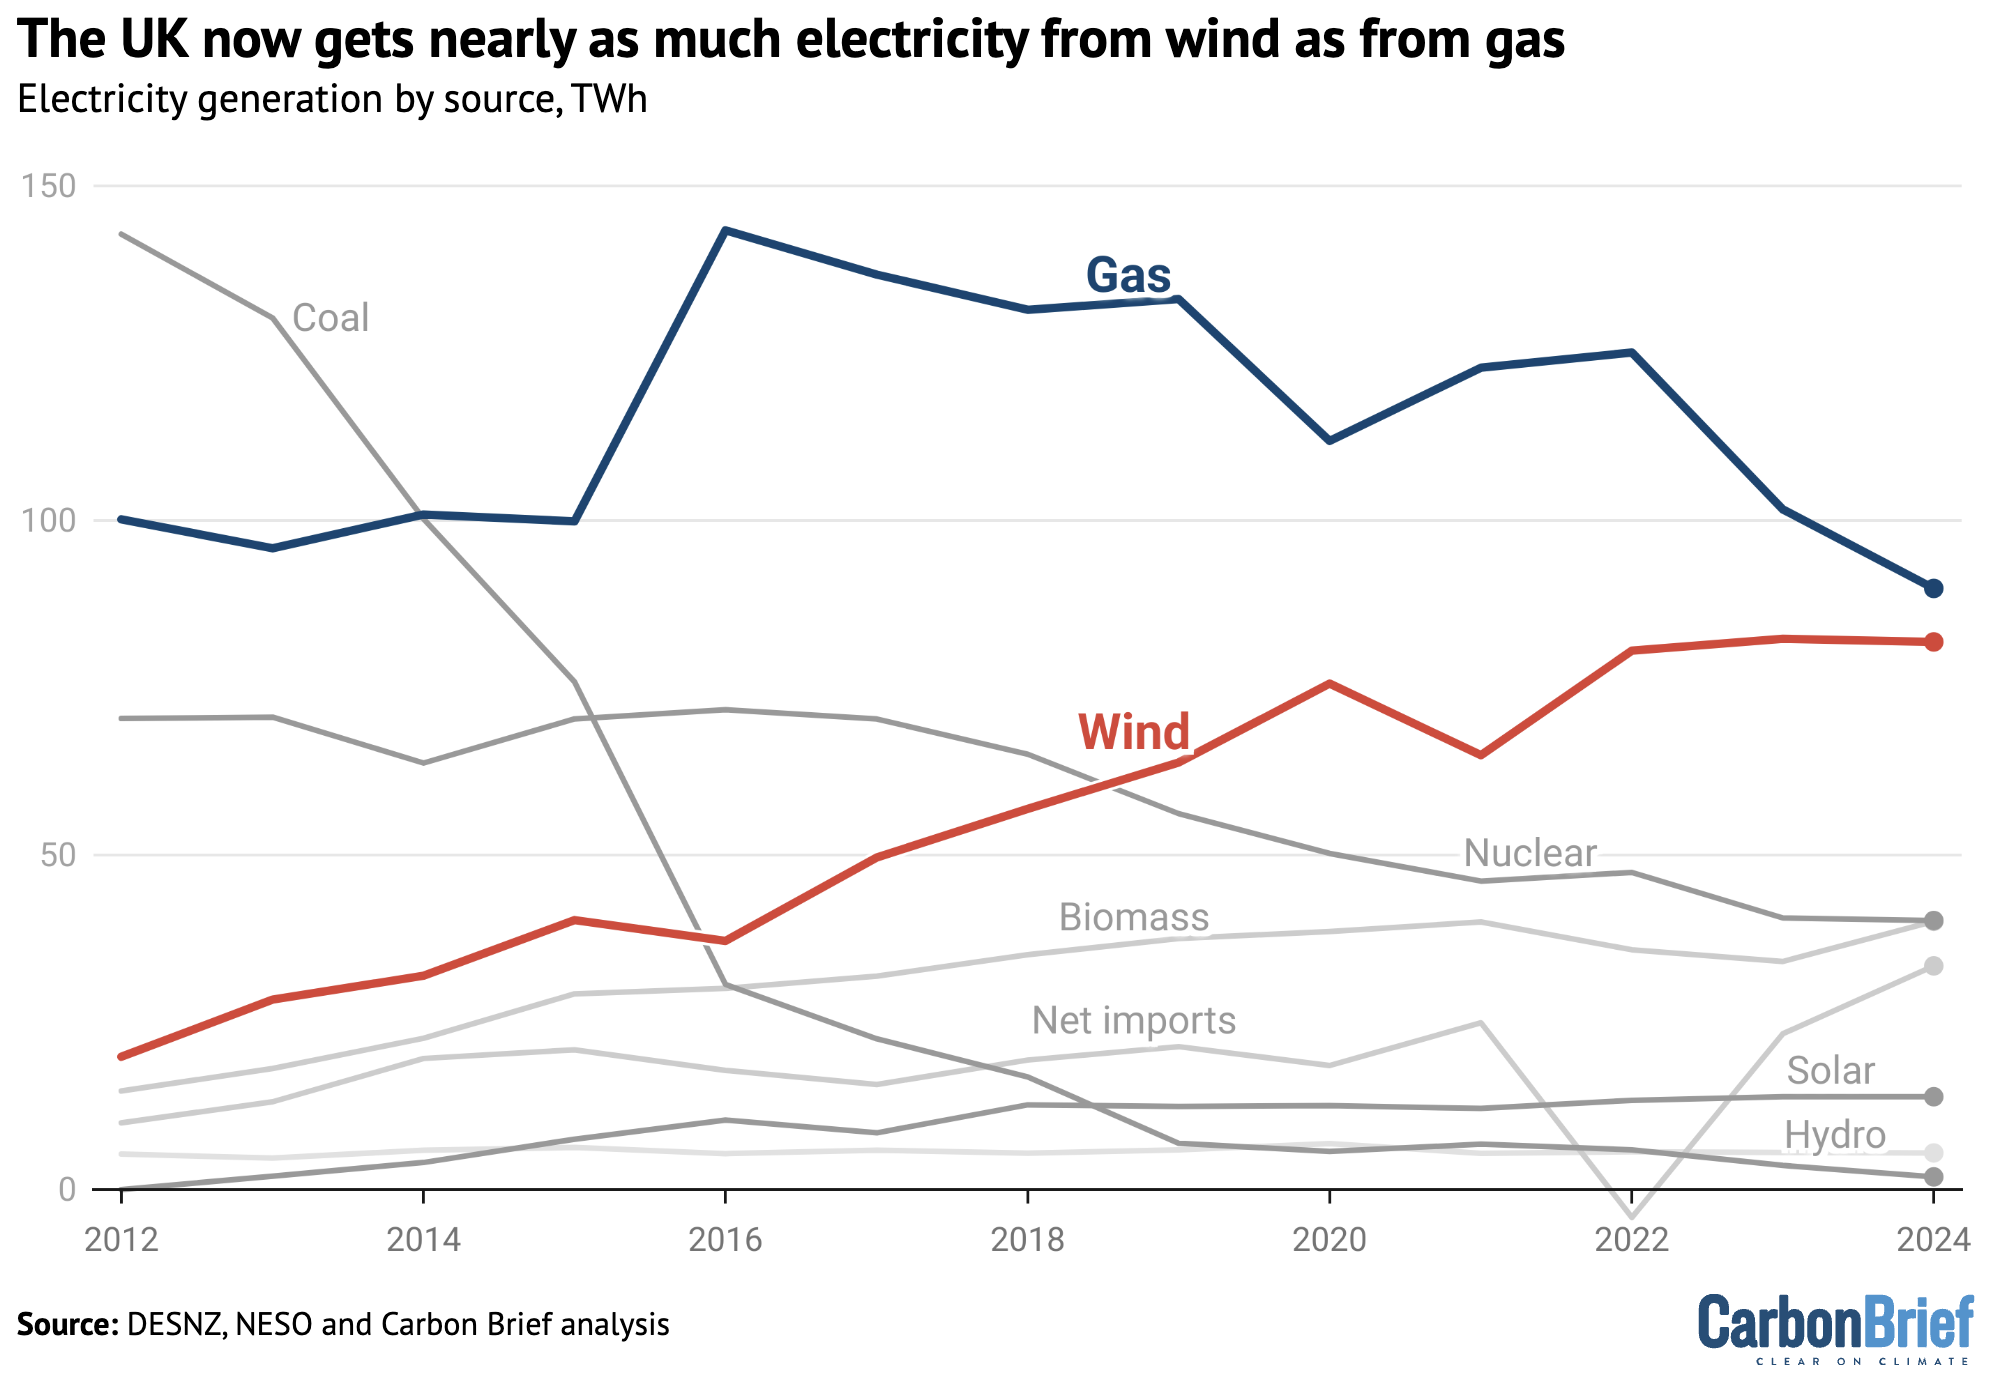
Notably, the rise in wind power output has levelled off over the past two years. The main reason for this is that very little new wind capacity has been added.
In 2022, the UK added 3.5 gigawatts (GW) of new wind capacity, including 3.2GW of offshore wind. This dropped to 1.6GW in 2023, of which 1.1GW came from the Seagreen offshore windfarm off the coast of Scotland, which is currently the nation’s largest and the third-largest in the UK.
However, no new offshore windfarms were added in 2024 and only 0.7GW of new onshore capacity was built, mainly the 0.4GW Viking project in the Shetland Islands.
A further reason for the levelling off in wind power output is that windspeeds have been below average for the past two years.
October and November 2024 have seen particularly poor wind conditions in the UK, respectively 7% and 22% below average – and it has been calm elsewhere in Europe too.
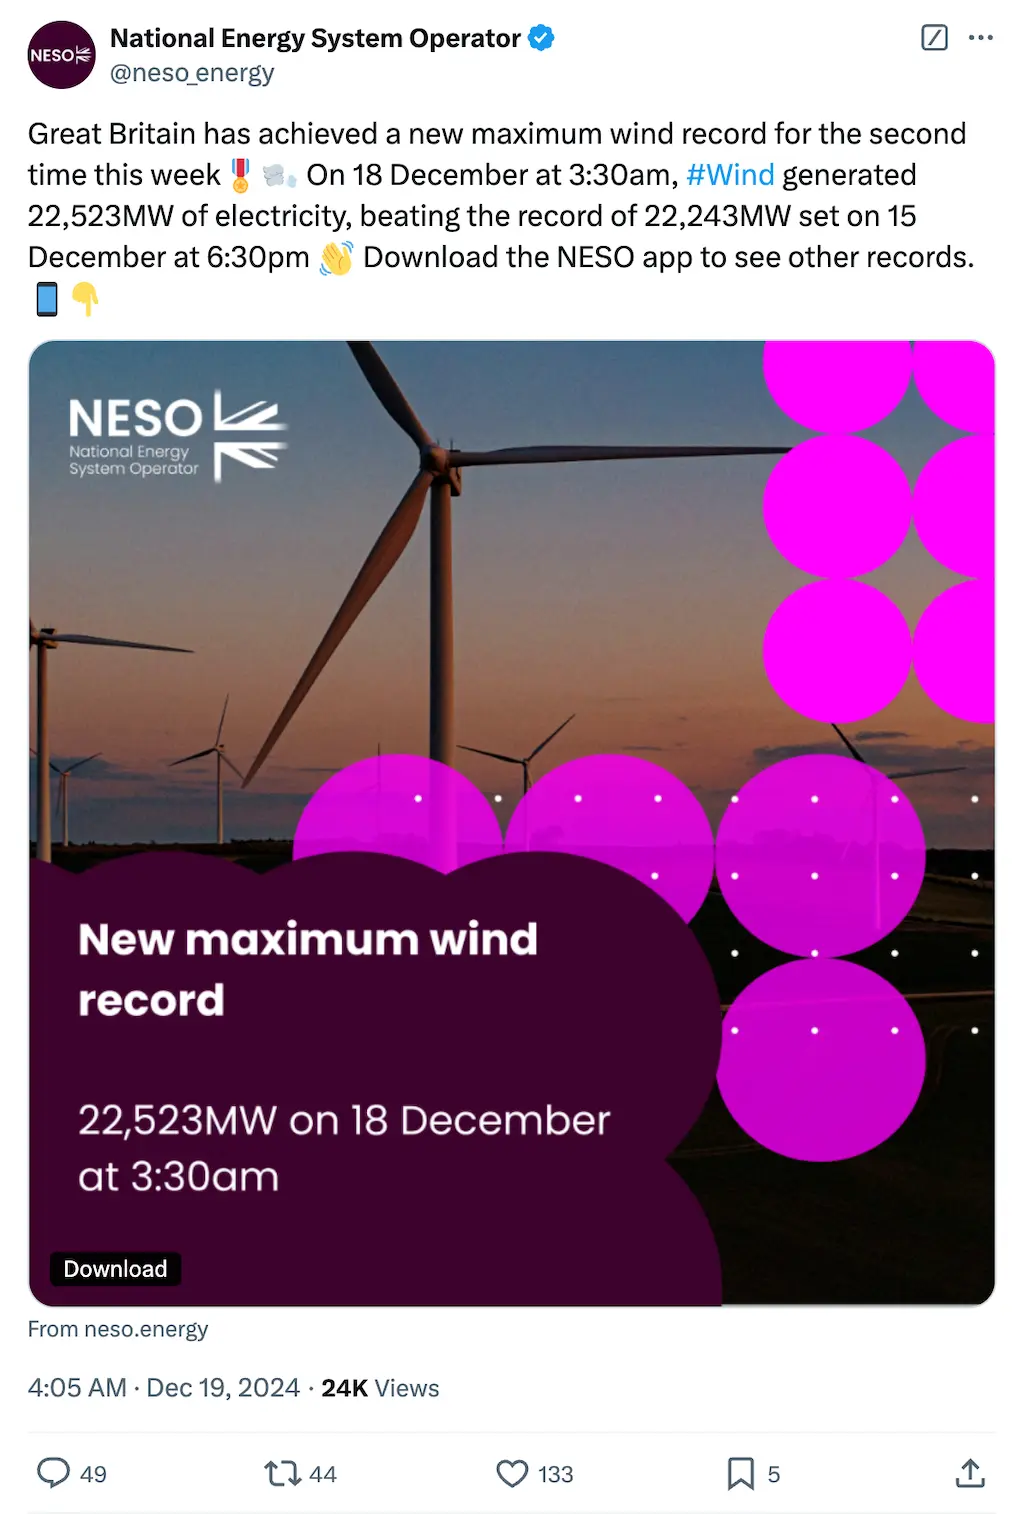
Nevertheless, a new record for wind generation was hit on 19 December 2024, with output reaching 22.5GW for the first time, according to NESO.
Several large new offshore windfarms are under construction and due to open in 2025 or 2026.
These include Dogger Bank A, a 1.2GW development in the North Sea due to open next year, as are the 0.9GW Moray West and 0.5GW Neart na Goithe windfarms off Scotland.
In 2026, these projects are due to be followed by the 1.2GW Dogger Bank B and 1.4GW Sofia windfarms, also in the mid-North Sea region.
Given these new developments and the likelihood that windspeeds will return towards average levels, it is likely that the UK will get more electricity from wind than from gas in 2025.
Biomass is the second largest source of renewable electricity in the UK, generating 40TWh in 2024. This is up 17% from 34TWh in 2023, but roughly the same as in 2022.
The UK’s largest biomass generator, the Drax former coal plant in Yorkshire, had seen subdued output in recent years due to planned outages for refurbishment.
Note that Drax only accounts for around a third of biomass generation, with other biomass power sources, including landfill gas, sewage gas and anaerobic digestion of organic waste.
The UK’s net imports of electricity also reached a record high in 2024, with cheaper prices on the continent and new interconnector capacity meaning more power flowed into the country.
Lower lifecycle
The UK’s cleaner electricity generation in 2024 makes electrified heat and transport far more beneficial in terms of reducing CO2 emissions.
For example, an average petrol car in the UK generates 2.7 tonnes of CO2 (tCO2) per year. In 2014, an EV would have generated 830kg of CO2 – but in 2024 this was just 245kg.
Based on the CO2 intensity of electricity in 2014, it would have taken 16,000 miles (2.2 years) for an EV to pay off the “carbon debt” associated with producing its battery, relative to a petrol car.
Based on the cleaner electricity generated in 2024, this payback is just 12,000 miles (1.6 years).
Put another way, an EV driven on 2014 electricity across its full lifetime would have had lifecycle CO2 emissions that were 50% lower than a petrol car. Now, the lifecycle saving is 70%.
There have been similar benefits for CO2 emissions from household energy use, particularly those that use an electric heat pump.
In 2014, a household with average demand would have been responsible for 1.1tCO2 from its electricity use. Today, that figure has fallen to 0.3tCO2.
For a household with a heat pump, emissions from home heating will have fallen from 1.4tCO2 in 2014 to just 0.4tCO2 in 2024. This means that instead of cutting their annual CO2 emissions from heat by 45%, as they were in 2014, they are now reducing their CO2 output by 84%.
Methodology
The figures in the article are from Carbon Brief analysis of data from DESNZ Energy Trends chapter 5 and chapter 6, as well as from NESO. The figures from NESO are for electricity supplied to the grid in Great Britain only and are adjusted here to include Northern Ireland.
In Carbon Brief’s analysis, the NESO numbers are also adjusted to account for electricity used by power plants on site and for generation by plants not connected to the high-voltage national grid.
NESO already includes estimates for onshore windfarms, but does not cover industrial gas combined heat and power plants and those burning landfill gas, waste or sewage gas.
Carbon intensity figures from 2012 onwards are taken directly from NESO. Pre-2012 estimates are based on the NESO methodology, taking account of fuel use efficiency for earlier years.
The carbon intensity methodology accounts for lifecycle emissions from biomass. It includes emissions for imported electricity, based on the daily electricity mix in the country of origin.
DESNZ historical electricity data, including years before 2012, is adjusted to align with other figures and combined with data on imports from a separate DESNZ dataset. Note that the data prior to 1951 only includes “major” power producers.
The post Analysis: UK’s electricity was cleanest ever in 2024 appeared first on Carbon Brief.


