
Hunger has, on average, fallen worldwide after hitting 15-year highs in 2021 and 2022.
This is one of the key findings from the latest “State of Food Security and Nutrition in the World” (SOFI) report, an annual assessment produced jointly by the UN Food and Agriculture Organization (FAO), International Fund for Agricultural Development, UN Children’s Fund, World Food Programme and World Health Organization.
The SOFI report also examines the cost of a “healthy” diet around the world, the surge in food price inflation and the contribution of energy and fertiliser prices to overall food inflation.
In a statement, FAO director-general Dr Qu Dongyu said that it is “encouraging” to see the world making progress on hunger, but added: “We must recognise that progress is uneven.”
Below, Carbon Brief highlights five charts from the report which explain the state of food insecurity around the world.
- Hunger decreased in recent years in most parts of the world, following sharp increases in 2020-21
- The cost of a healthy diet increased around the world
- Food price inflation outstripped general inflation over 2019-25
- Gas price shocks contributed to high commodity prices
- Fertiliser prices have remained high following Russia’s invasion of Ukraine
1. Hunger decreased in recent years in most parts of the world, following sharp increases in 2020-21

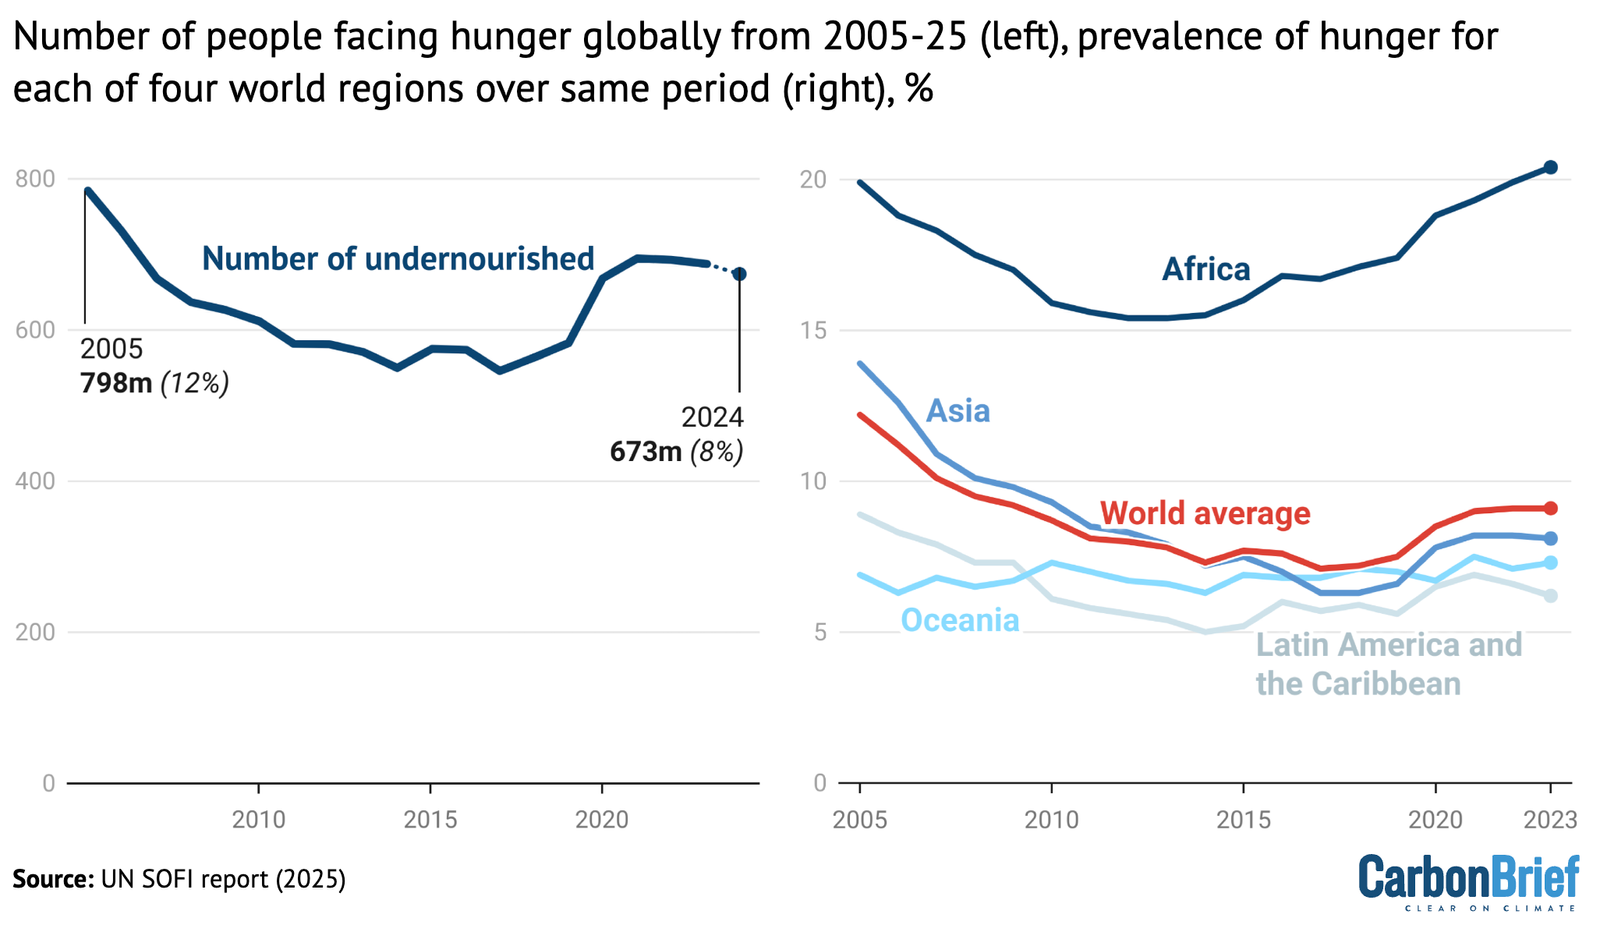
Number of undernourished people, globally, from 2005-24 (left) and the prevalence of undernourishment (right) for the world (red), Africa (dark blue), Asia (blue), Latin America and the Caribbean (light blue) and Oceania (cyan) over the same time period. Credit: Carbon Brief, based on the UN State of Food Security and Nutrition in the World report (2025)
Since 1975, the FAO has tracked the prevalence of undernourishment – the proportion of the population in each country who does not regularly consume sufficient amounts of food for sustaining a healthy life.
These estimates are used to assess progress on achieving global goals, such as the 2030 Sustainable Development Goals (SDGs), launched in 2015.
The left-hand chart above shows the number of people facing hunger each year from 2005-24. The right-hand chart shows the percentage of the population facing hunger over this time period for the world as a whole (red), Africa (dark blue), Asia (blue), Latin America and the Caribbean (light blue) and Oceania (cyan).
Over the past 20 years, undernourishment broadly decreased until 2016 and then began to rise sharply in 2020 and 2021. This increase coincided with the Covid-19 pandemic.
The report estimates that the population facing hunger in 2024 was between 638 million and 720 million people, or between 7.8% and 8.8% of the global population.
The report sets its “best estimate” of the population facing hunger at 673 million people, which represents a decrease of 15 million people compared to the previous year.
However, the report notes that the progress made in reducing hunger worldwide has been uneven, as seen in the chart above.
There were improvements in south-west and southern Asia, as well as Latin America, but a continuing rise in hunger in much of Africa and western Asia.
The report also finds that around 2.3 billion people were “moderate or severely food insecure” in 2024, noting that this represents an increase of 683 million more people than when the SDGs was launched a decade ago.
The report projects that by 2030 around 512 million people could face chronic hunger, with 60% of the world’s undernourished people located in Africa.
It highlights that achieving the goal of eliminating hunger by 2030 will be an “elusive target”.
The report warns that the “deteriorating food insecurity” in territories and countries currently affected by humanitarian crises – such as the Gaza Strip, South Sudan, Sudan, Yemen and Haiti – may not be fully reflected in its current estimates.
2. The cost of a healthy diet increased around the world
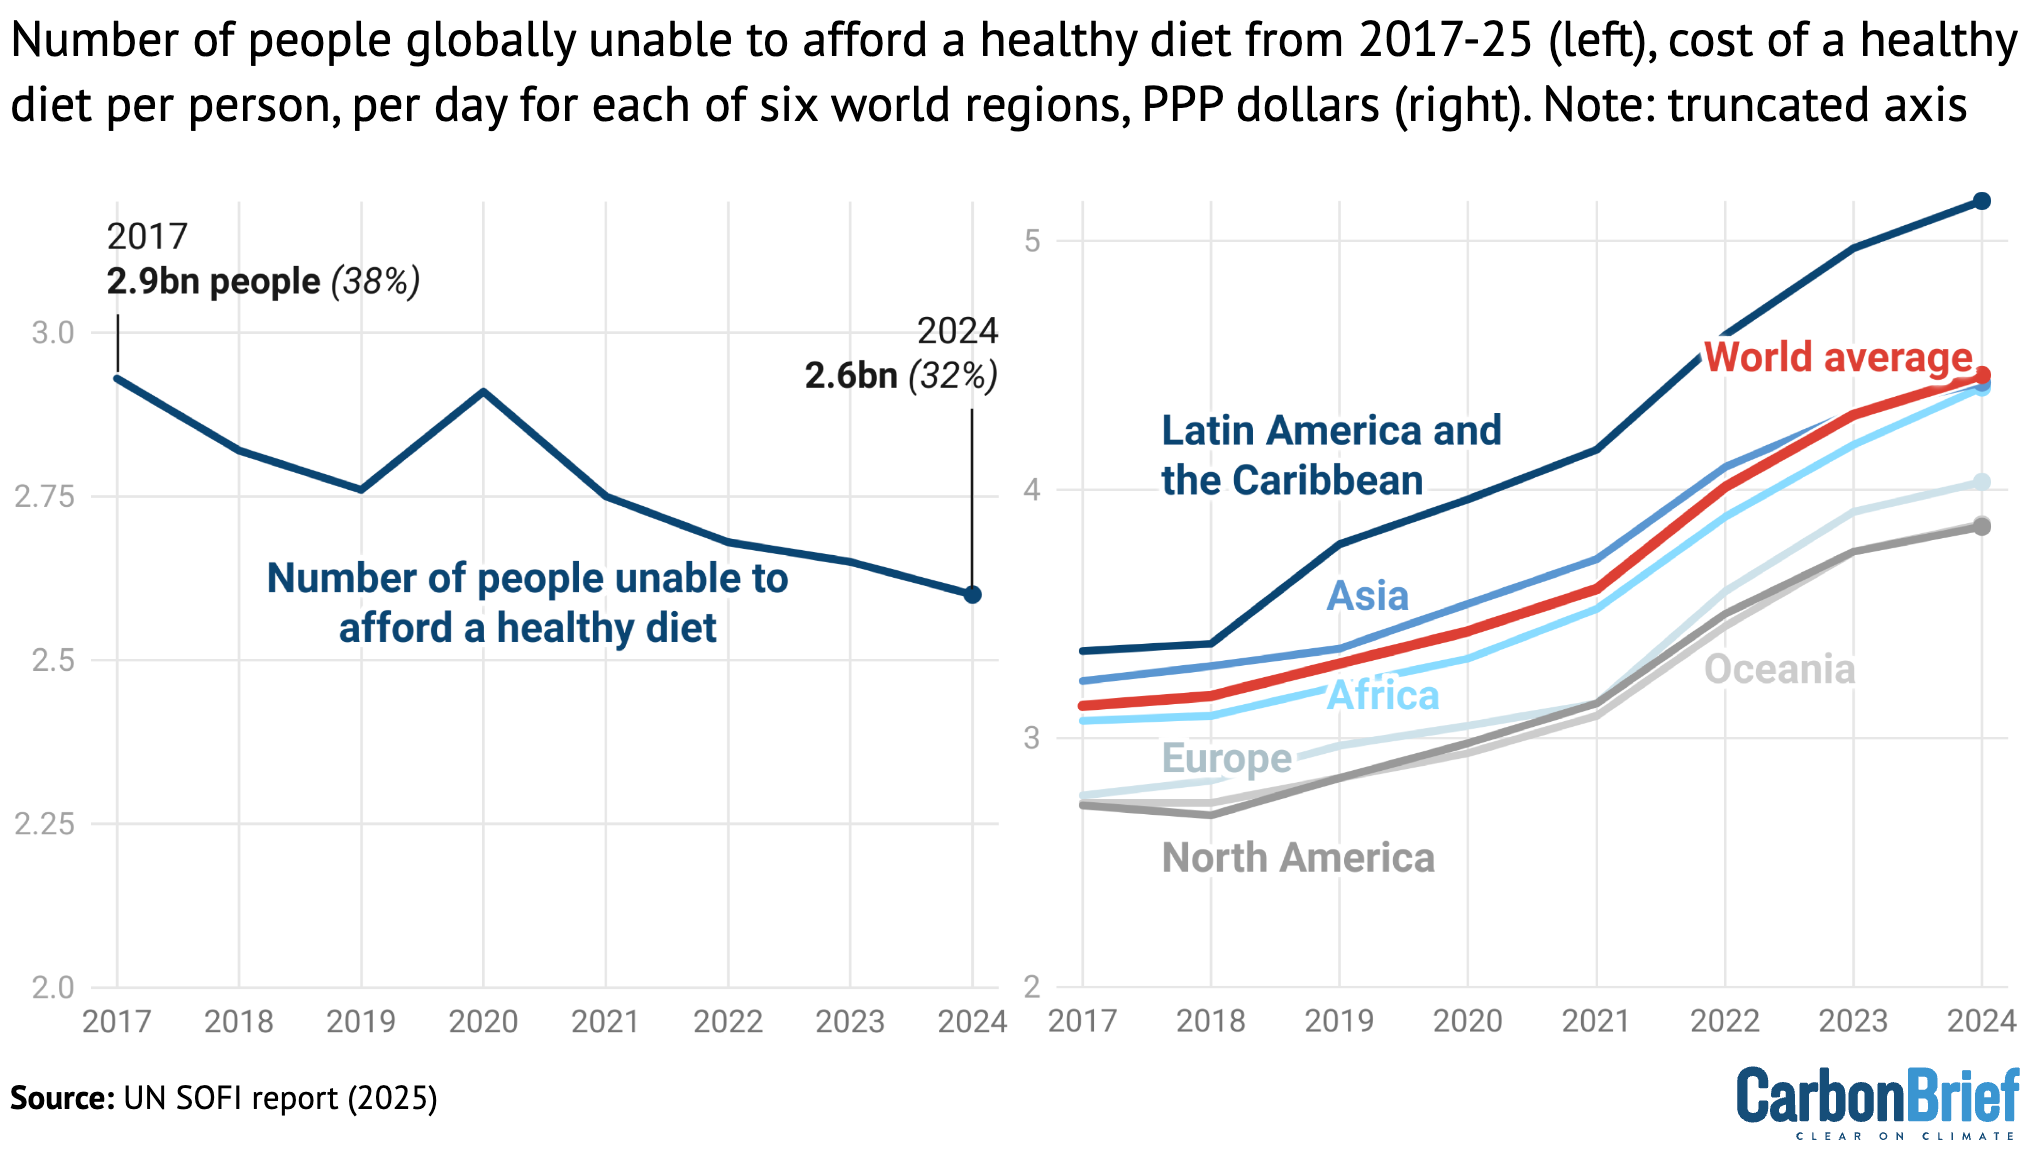
The number of people around the world who were unable to afford a healthy diet (left) from 2017-24. The cost of a healthy diet per person, per day in purchasing power parity dollars (right) for the world (red), Africa (cyan), Asia (blue), Europe (light blue), Latin America and the Caribbean (dark blue), North America (dark grey) and Oceania (light grey). Credit: Carbon Brief, based on the UN State of Food Security and Nutrition in the World report (2025)
The report finds that the cost of a “healthy” diet rose during 2023 and 2024.
It defines a “healthy” diet as one that comprises a “variety of locally available foods that meet energy and most nutrient requirements”. A healthy diet should be diverse, adequate and balanced, while maintaining moderation in consumption of food related to poor health outcomes, the report says.
In 2019, a healthy diet cost, on average, 3.30 purchasing power parity (PPP) dollars per person, per day. (Purchasing power parity is a type of currency conversion, based on the cost of goods in different locations, that allows one to compare the purchasing power of different currencies.)
By 2024, increasing food prices had driven this cost up to 4.46 PPP dollars, the report says.
At the same time, the report finds that the proportion of the population unable to afford a healthy diet has decreased every year since 2017, with the exception of 2020. For example, in 2020, the number of people worldwide who could not afford healthy food was 2.9 billion, which fell to 2.6 billion in 2024.
This is due to the economic recovery following the Covid-19 pandemic, which led to an increase in incomes that outstripped the rise in food prices, the report says.
The chart above shows how the global population was unable to afford a healthy diet each year from 2017-24 (left) and the average cost of a healthy diet, in PPP dollars per person, per day (right, red). The right-hand chart also shows the cost in each of six regions: Latin America and the Caribbean (dark blue), Asia (blue), Africa (cyan), Europe (light blue), Oceania (light grey) and North America (dark grey).
However, not all regions experienced the same economic recovery, it adds.
Asia, as a whole, saw the largest decrease in the unaffordability of healthy food – with the proportion of people unable to afford a healthy diet falling from 35% in 2019 to 28% in 2024. In contrast, the unaffordability of healthy diets increased “substantially” in Africa, with two-thirds of the population unable to afford healthy diets in 2024.
The rest of the world’s regions – with the exception of Oceania – saw a “marginal” decrease in the unaffordability of healthy food in recent years, the report says.
There are significant differences in affordability according to national incomes.
In low-income countries, the number of people unable to afford a healthy diet “has been steadily increasing since 2017”, says the report. This is attributed to a recent halt in economic growth and a sharp rise in food prices.
In lower-middle-income countries, that number decreased from 2020 to 2024, mainly due to improvements in affordability in India.
Conversely, in upper-middle- and high-income countries, the number of people unable to afford healthy food has been declining since 2020.
The report concludes that “people who are unable to afford even a least-cost healthy diet are likely experiencing some level of food insecurity”.
3. Food price inflation outstripped general inflation over 2019-25
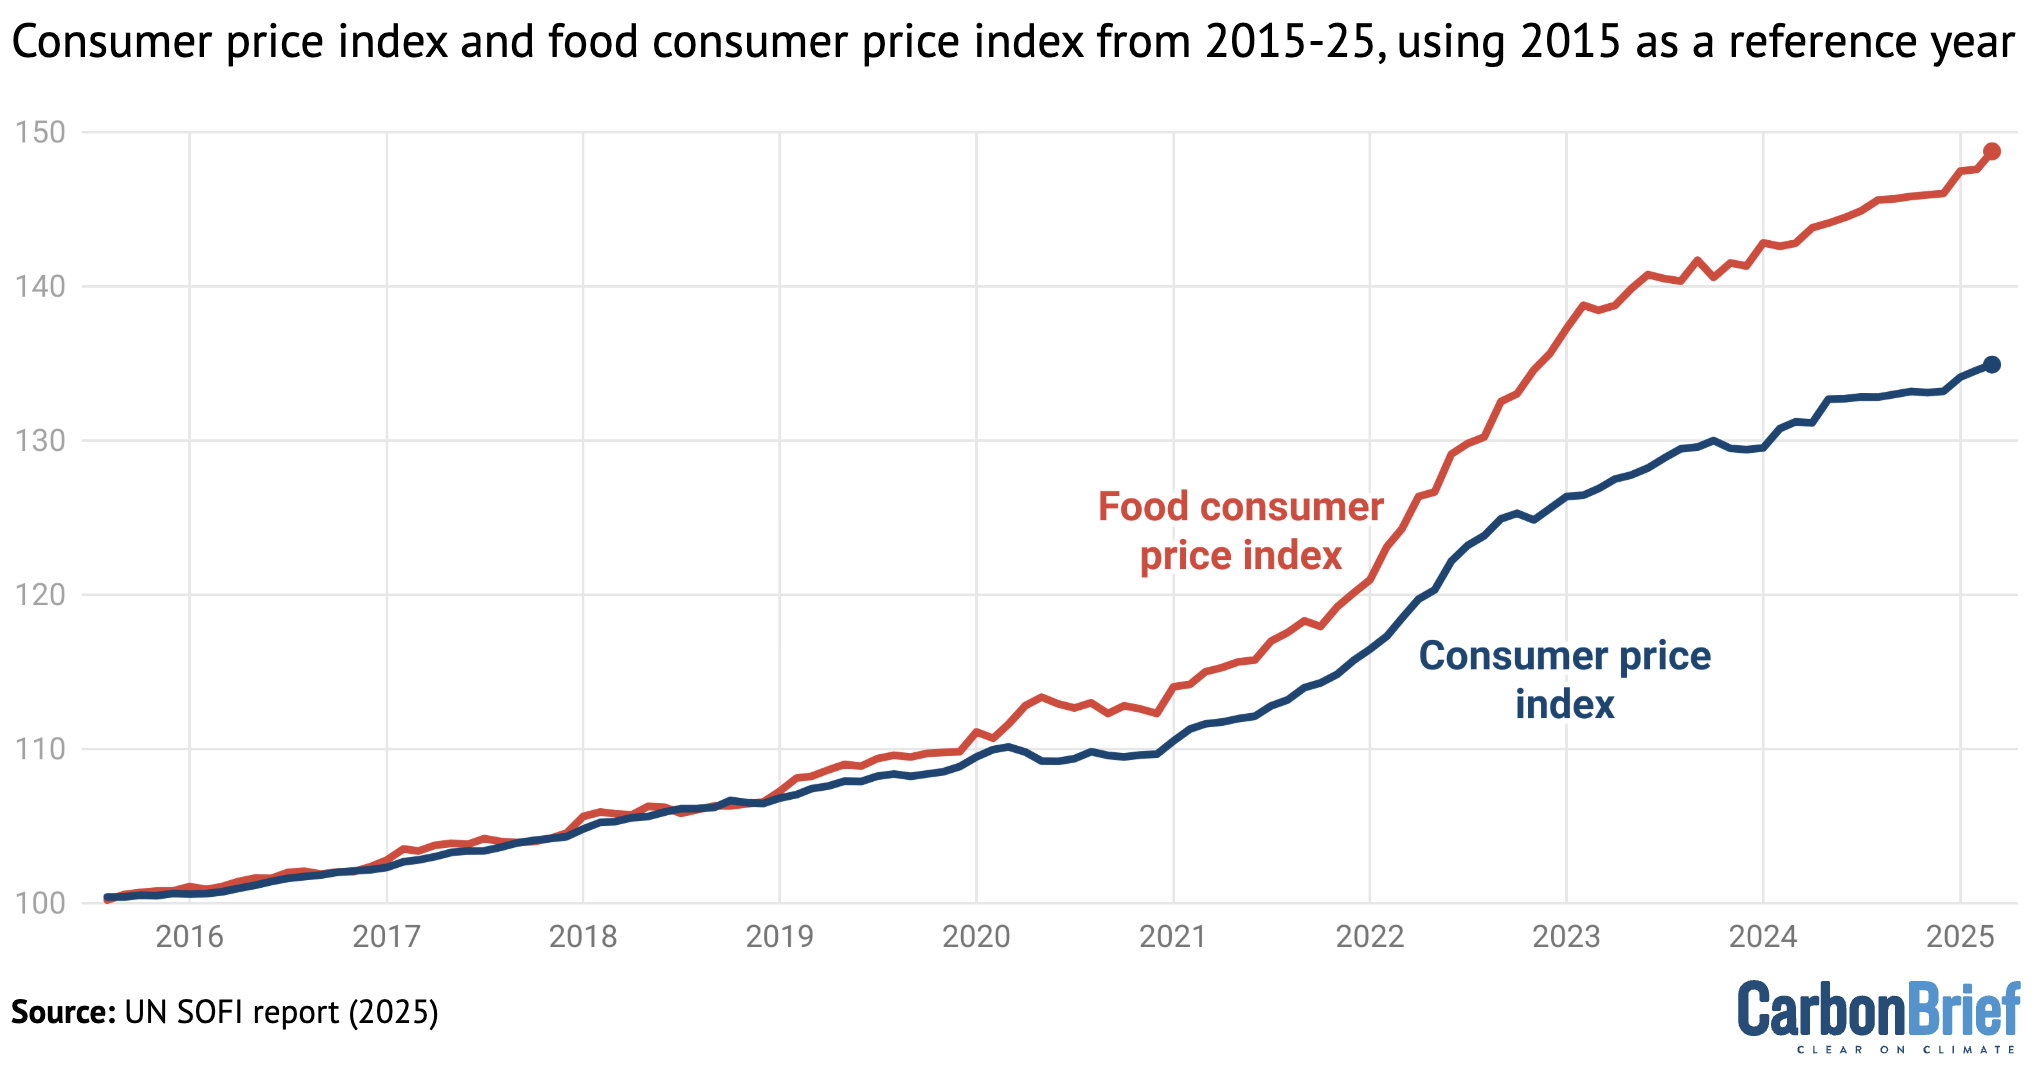
Consumer price index (blue) and food consumer price index (red) from 2015-25, using 2015 as a reference year. Credit: Carbon Brief, based on the UN State of Food Security and Nutrition in the World report (2025)
The report finds that food price inflation has “significantly” outstripped general inflation over the past five years. Median global food price inflation rose from 2.3% in December 2020 to 13.6% in January 2023.
The chart above shows consumer price index (blue) – which includes price changes to all of the items a household typically consumes – and the consumer food price index (red) over 2015-25, with 2015 taken as the reference year.
The highest rates of inflation occurred in low-income countries, with several countries experiencing “hyperinflation”, including inflation levels above 350%. The report explains that most households in low-income countries source much of their food from local markets, which are more vulnerable to price shocks.
The authors attribute the heightened inflation to a combination of factors that includes the Covid-19 pandemic, the war in Ukraine and shifting monetary policy – from lowering interest rates and launching fiscal support at the beginning of the pandemic to raising interest rates to combat surging prices.
According to the report, previous food-price shocks – such as the one that occurred during the 2008 global financial crisis – were “predominantly” driven by supply, while the current surging inflation was driven initially by demand.
Supply-side shocks occur when production or distribution of food are disrupted by external factors, resulting in a “steep and prolonged rise in food prices”. Supply-side shocks create “persistent inflationary pressures”, the report says.
Demand-side shocks – a “sudden and unexpected increase in consumer demand for food products” – are often due to economic growth and changes in consumption patterns. (The report cites as an example the Covid-19 pandemic, which led to a “surge” in demand for food at home.) Demand-side shocks are characterised by rapid increases in price, but do not typically have a long-term impact.
In addition to the global factors driving food inflation, localised shocks – such as extreme weather events – impacted inflation on sub-national and national scales, by destroying crops, disrupting supply chains and suppressing household incomes.
Since 2020, the report says, 139 out of 203 countries have faced cumulative food price inflation above 25%, with 49 countries experiencing cumulative food inflation higher than 50%. It warns:
“Such prolonged food price pressures risk undermining household coping capacities and worsening food insecurity.”
According to the report, food price rises of 10% are associated with a 3.5% rise in “moderate or severe” food insecurity, with women “disproportionately affected”.
It also notes that food price inflation has previously been found to have “detrimental effects on child nutrition”, particularly among vulnerable populations.
4. Gas price shocks contributed to high commodity prices
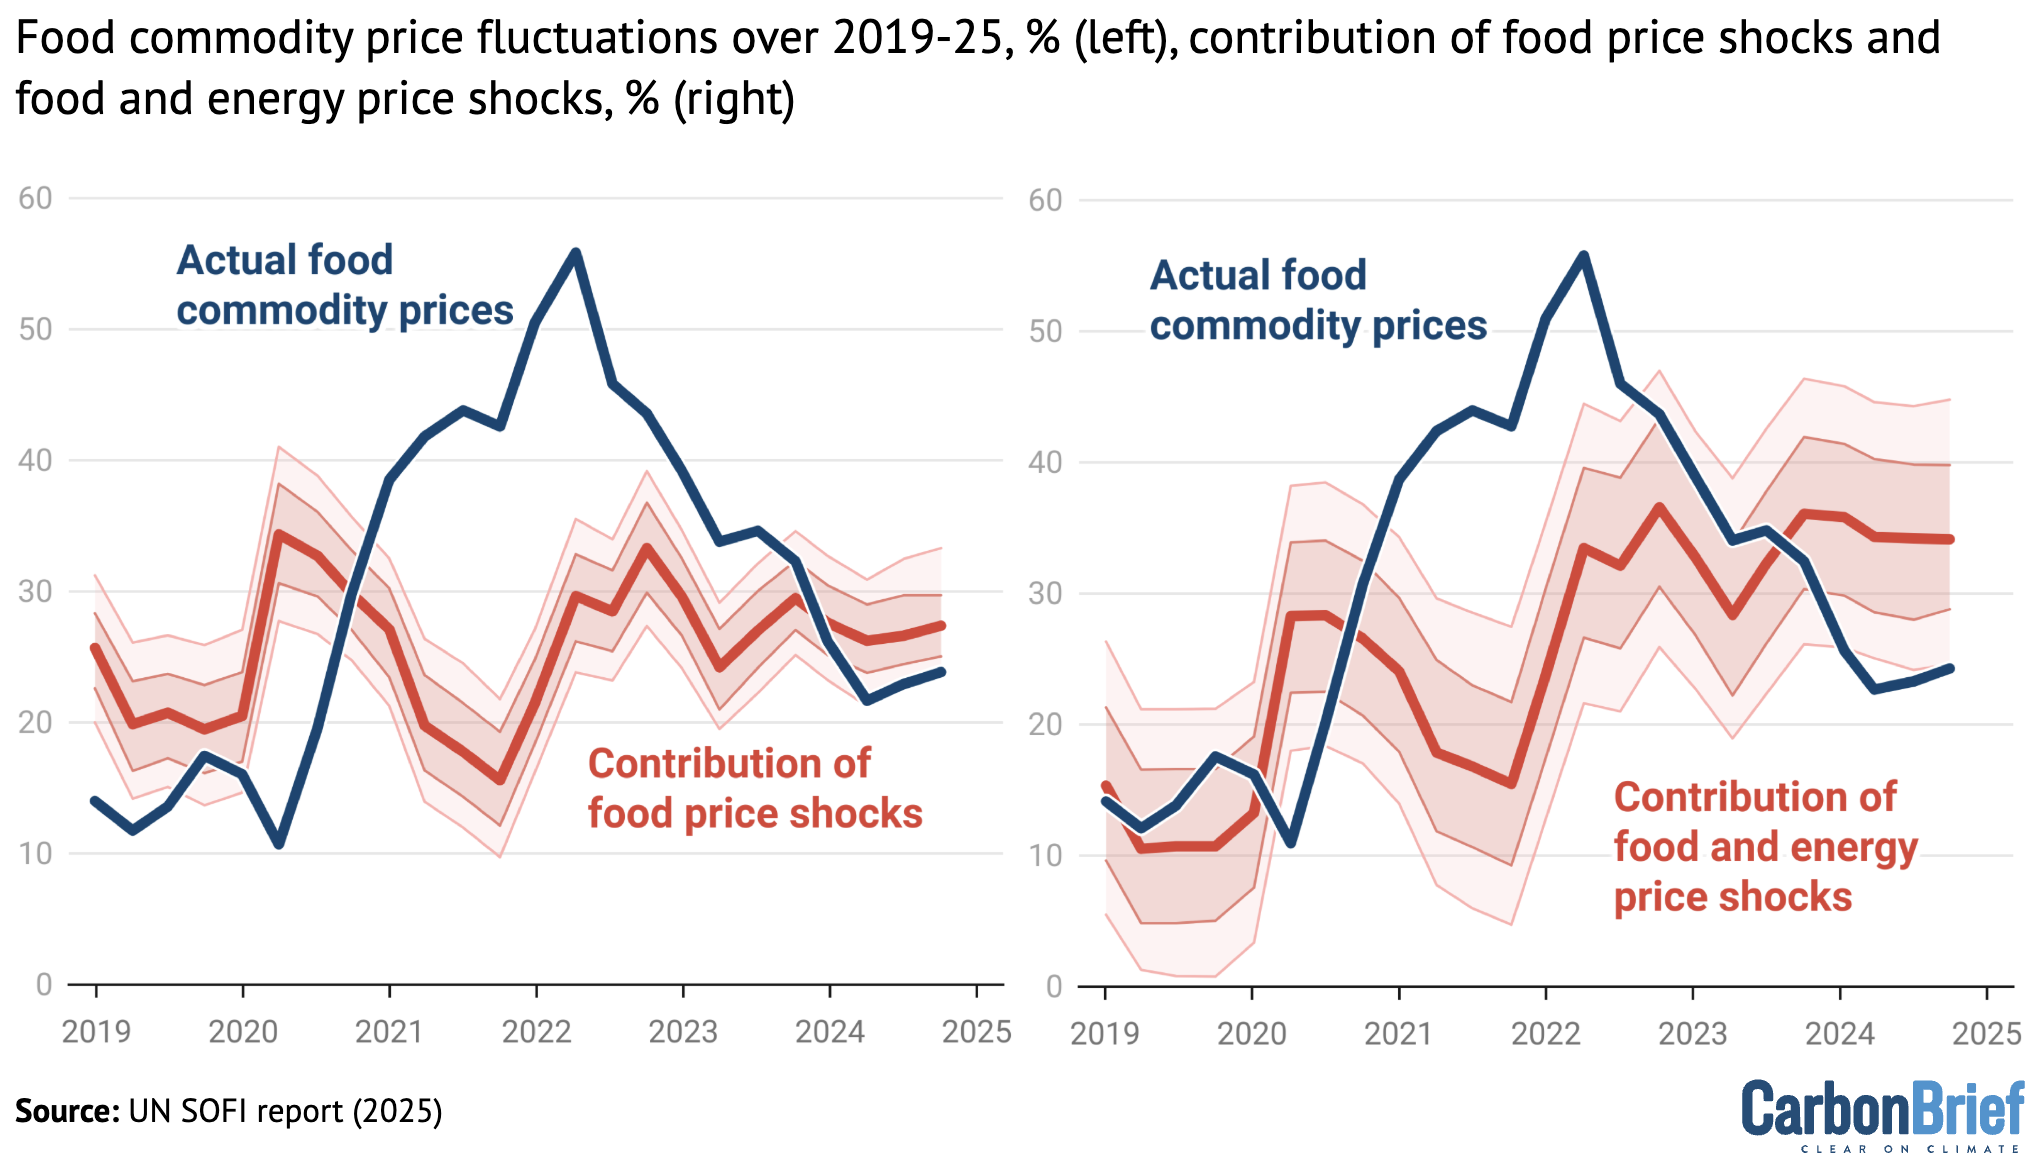
Contribution of food price shocks (left) and food and energy price shocks (right) to global commodity food prices, from 2019-25. Overall fluctuations in food commodity prices are shown in dark blue on both charts. Credit: Carbon Brief, based on the UN State of Food Security and Nutrition in the World report (2025)
Rising food prices were amplified by rising energy costs over the past several years, the report says.
It points out that oil and gas are “key input[s] in agriculture production – from fertiliser manufacturing through to transportation”.
(Nitrogen-based fertilisers are typically produced using fossil gas as an input. The process of manufacturing them is an energy-intensive one – accounting for about 1% of all global energy usage.)
The report cites two “waves” of shocks that “largely shaped” the changes in agricultural commodity prices over 2020-22.
The first wave, it says, occurred early in the Covid-19 pandemic as food supplies contracted due to supply-chain disruptions, as well as “precautionary trade restrictions and increased stockpiling”.
Global energy markets were further “destabilised” by the second shockwave – Russia’s invasion of Ukraine in February 2022. Prior to the outbreak of the war, Russia was the third-largest producer of oil and the second-largest producer of fossil gas in the world.
The war resulted in “significant price increases and heightened volatility”, which translated into higher production costs economy-wide, the report says.
The initial surge at the beginning of the pandemic contributed about 15 percentage points to global food inflation, while the war in Ukraine added 18 percentage points, the report says.
The charts above show global food price inflation (black lines) over 2019-25. The blue line in the left panel shows the contribution of “food price shocks”, such as the disruption of the Black Sea trade corridor and the decline in fertiliser exports from Russia. In the right panel, the red line shows the contribution of both food price and energy price shocks to food inflation.
According to the report, the rise in agricultural and energy commodity prices account for nearly half of food price inflation in the US and more than one-third of food price inflation in the Euro area during peak inflation over the past few years.
It adds that the remaining inflation is explained by several other factors, “including rising labour costs, exchange rate fluctuations and pricing behaviour along the supply chain”.
5. Fertiliser prices have remained high following Russia’s invasion of Ukraine
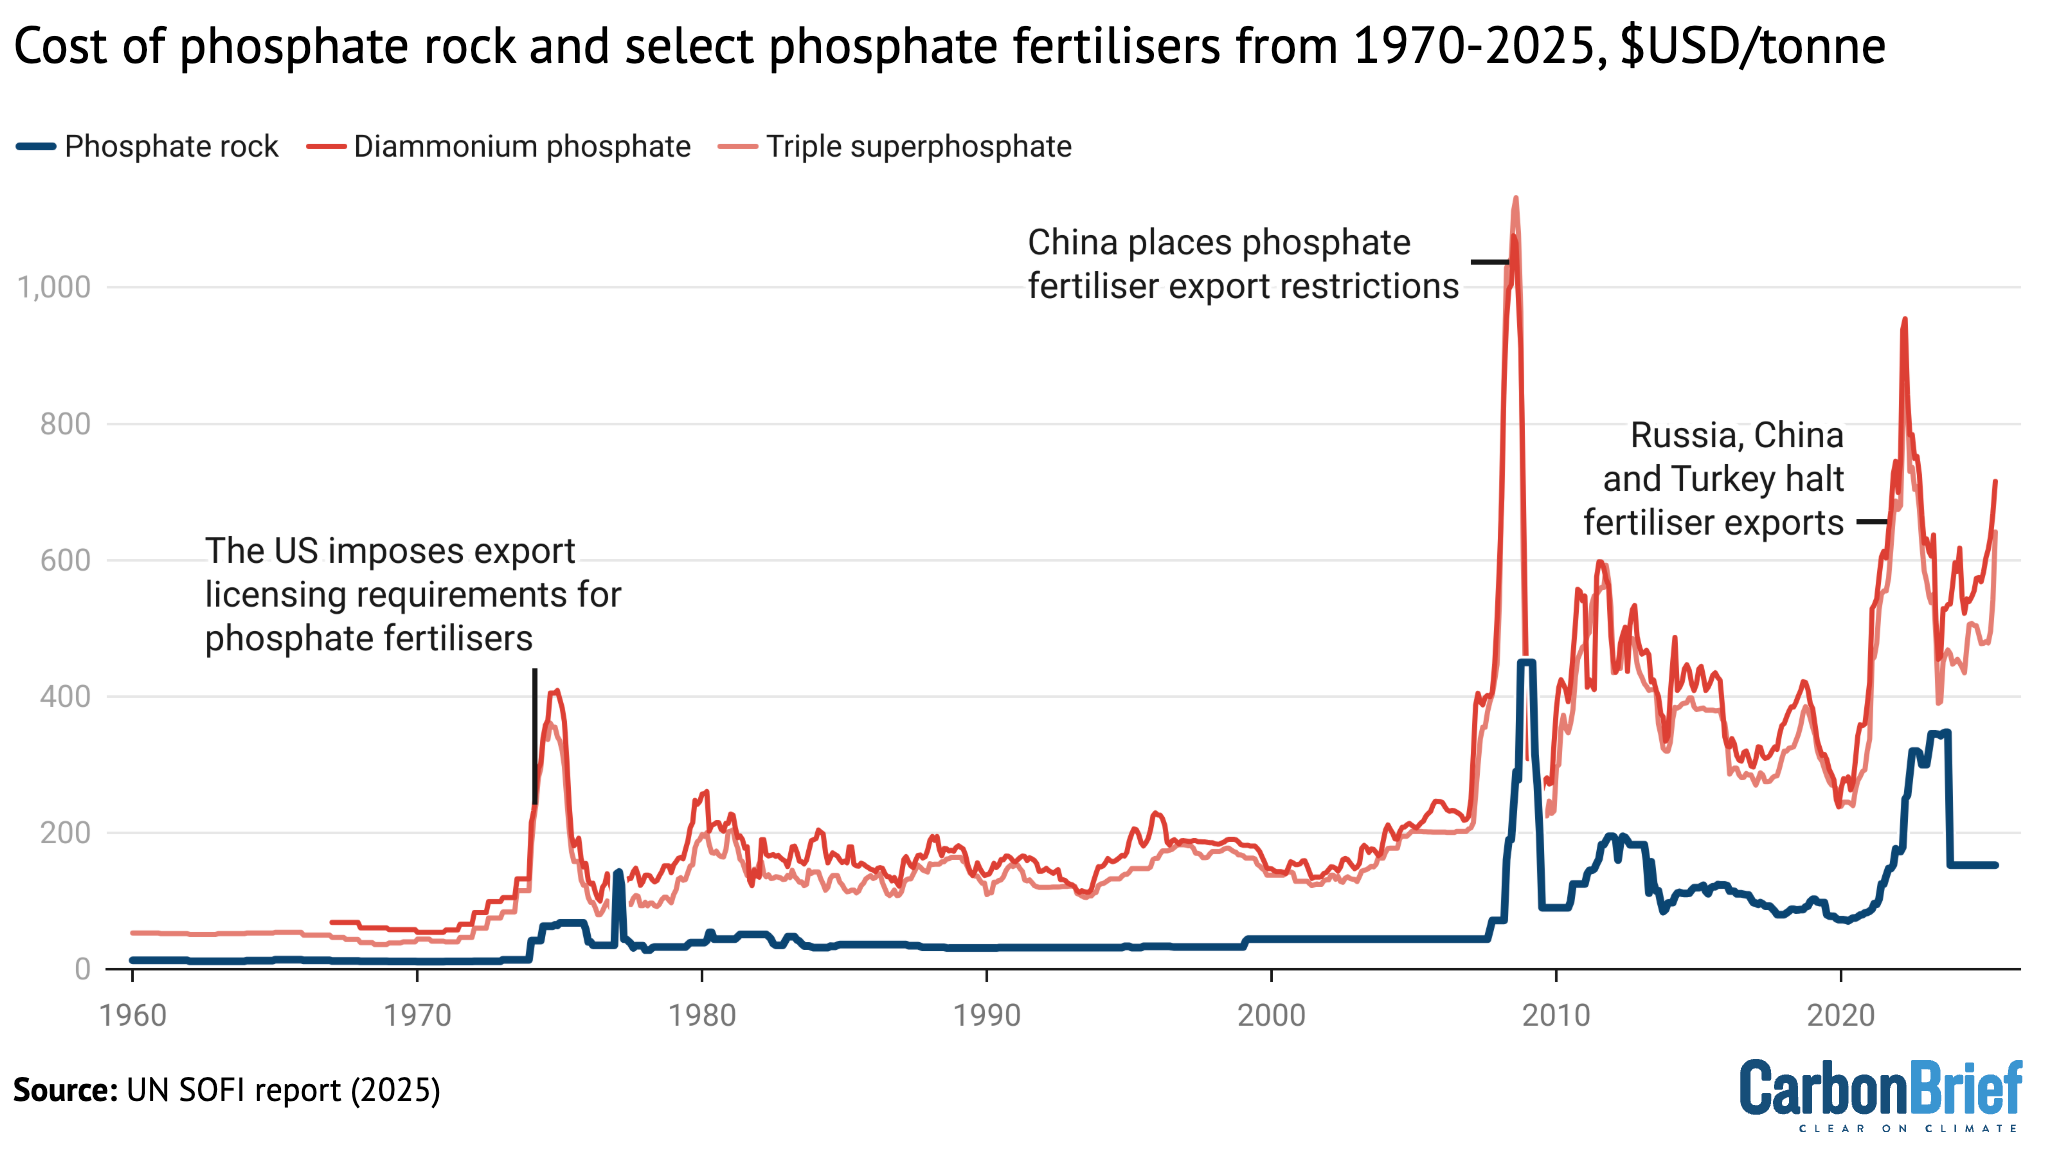
Monthly price of phosphate rock (blue), diammonium phosphate fertiliser (dark red) and triple superphosphate fertiliser (light red) from 1970-2025. Credit: Carbon Brief, based on the UN State of Food Security and Nutrition in the World report (2025)
The report notes that Russia’s invasion of Ukraine in February 2022 upended global fertiliser markets due to economic sanctions against Russia and Belarus – two of the world’s largest fertiliser exporters.
In 2020, Russia exported 14% of globally traded urea, the most commonly used nitrogen fertiliser. Belarus and Russia combined account for more than 40% of traded potash, a key potassium fertiliser.
While many of the sanctions against Russia following the outbreak of the war specifically omitted fertilisers and agricultural commodities, the report notes that restrictions on banking and trade increased the “cost of doing business” and restricted the ability of countries to purchase food and fertilisers from Russia.
However, the report points out, global potassium fertiliser prices were already on the rise prior to Russia’s invasion of Ukraine, due to export restrictions on fertilisers from China.
Similar trade measures on fertilisers – both export restrictions and import tariffs – have “played a role” in price spikes during previous episodes of global food price crises, including in 2007-08 and 2011-12, the report says.
The report looks specifically at phosphate fertilisers, noting that those prices have “historically been shaped by both long-term structural trends and short-term shocks”. These factors include trade restrictions, energy costs, geopolitical tensions and imbalances in supply and demand.
The chart above shows the monthly price of phosphate rock (blue), diammonium phosphate (dark red) and triple superphosphate (light red) from 1970 to 2025.
(Phosphate rock is the raw material used to manufacture most phosphate-based fertilisers, while diammonium phosphate and triple superphosphate are two commonly used phosphate fertilisers.)
Export restrictions were “critical factors” in driving the three major historical phosphate price spikes highlighted in the chart – in 1974, 2008 and 2021-22.
Given the small number of countries that produce phosphate fertilisers – their production is highly concentrated in China, the US, India, Russia and Morocco – these actions “exacerbat[e] global shortages”, the report says.
The report also points out that the concentration of agricultural markets – including the fertiliser market – is a “systemic issue that undermines efficiency and affordability” in both low- and high-income countries.
The post UN report: Five charts explaining the rise of global food insecurity appeared first on Carbon Brief.