
As 2026 passes its halfway point, the world is watching one of the most rapidly intensifying El Niño events in the modern record take shape in the tropical Pacific.
The developing El Niño is boosting expectations for global temperatures, both this year and next.
El Niño is the warm phase of a recurring climate pattern in the tropical Pacific that releases heat from the ocean into the atmosphere, temporarily raising global temperatures and reshaping rainfall and extreme weather around the world.
Carbon Brief’s “state of the climate” report in April gave 2026 a 19% chance of setting a new global temperature record.
That chance now stands at 35% – a near-doubling in four months – with virtually all of the change driven by ever-stronger El Niño forecasts.
The key findings from the first half of 2026 include:
- The first six months of 2026 were the third-warmest start to a year on record – around 1.4C above pre-industrial levels – behind only 2024 and 2025.
- While the first few months of the year came in as the fourth or fifth warmest, both May and June were the second-warmest ever recorded as El Niño conditions took hold.
- El Niño conditions arrived in April and reached the threshold for a “strong” event by June, when the Niño3.4 index reached 1.6C. Of the 667 model runs Carbon Brief examined, 91% project a peak later this year that is above the strongest El Niño in history.
- The chance that 2026 beats 2024 as the warmest year on record has risen to 35%. Carbon Brief’s central estimate remains that 2026 will be the second-warmest year, at around 1.51C above pre-industrial levels.
- Whether 2026 sets a record will depend on the dataset: the odds range from around two-in-three in NASA and Berkeley Earth data to around two-in-10 in ERA5 and one-in-10 in the JRA-3Q reanalyses.
- June 2026 was western Europe’s hottest June on record, amid a heatwave that set hundreds of individual records. Nearly 9% of the world’s surface saw record June warmth.
- The developing El Niño will have its largest impact on 2027, which Carbon Brief projects to be around 1.7C above pre-industrial levels – this would comfortably set a new record for the warmest year.
- Arctic sea ice has spent 39 days of 2026 so far at, or below, record daily lows following its joint-lowest winter maximum in the satellite era.
Third-warmest start to a year
Carbon Brief analyses records from six different groups that report global surface temperatures: NASA GISTEMP, NOAA GlobalTemp, Hadley/UEA HadCRUT5, Berkeley Earth, Copernicus/ECMWF ERA5 and the JMA JRA-3Q reanalysis.
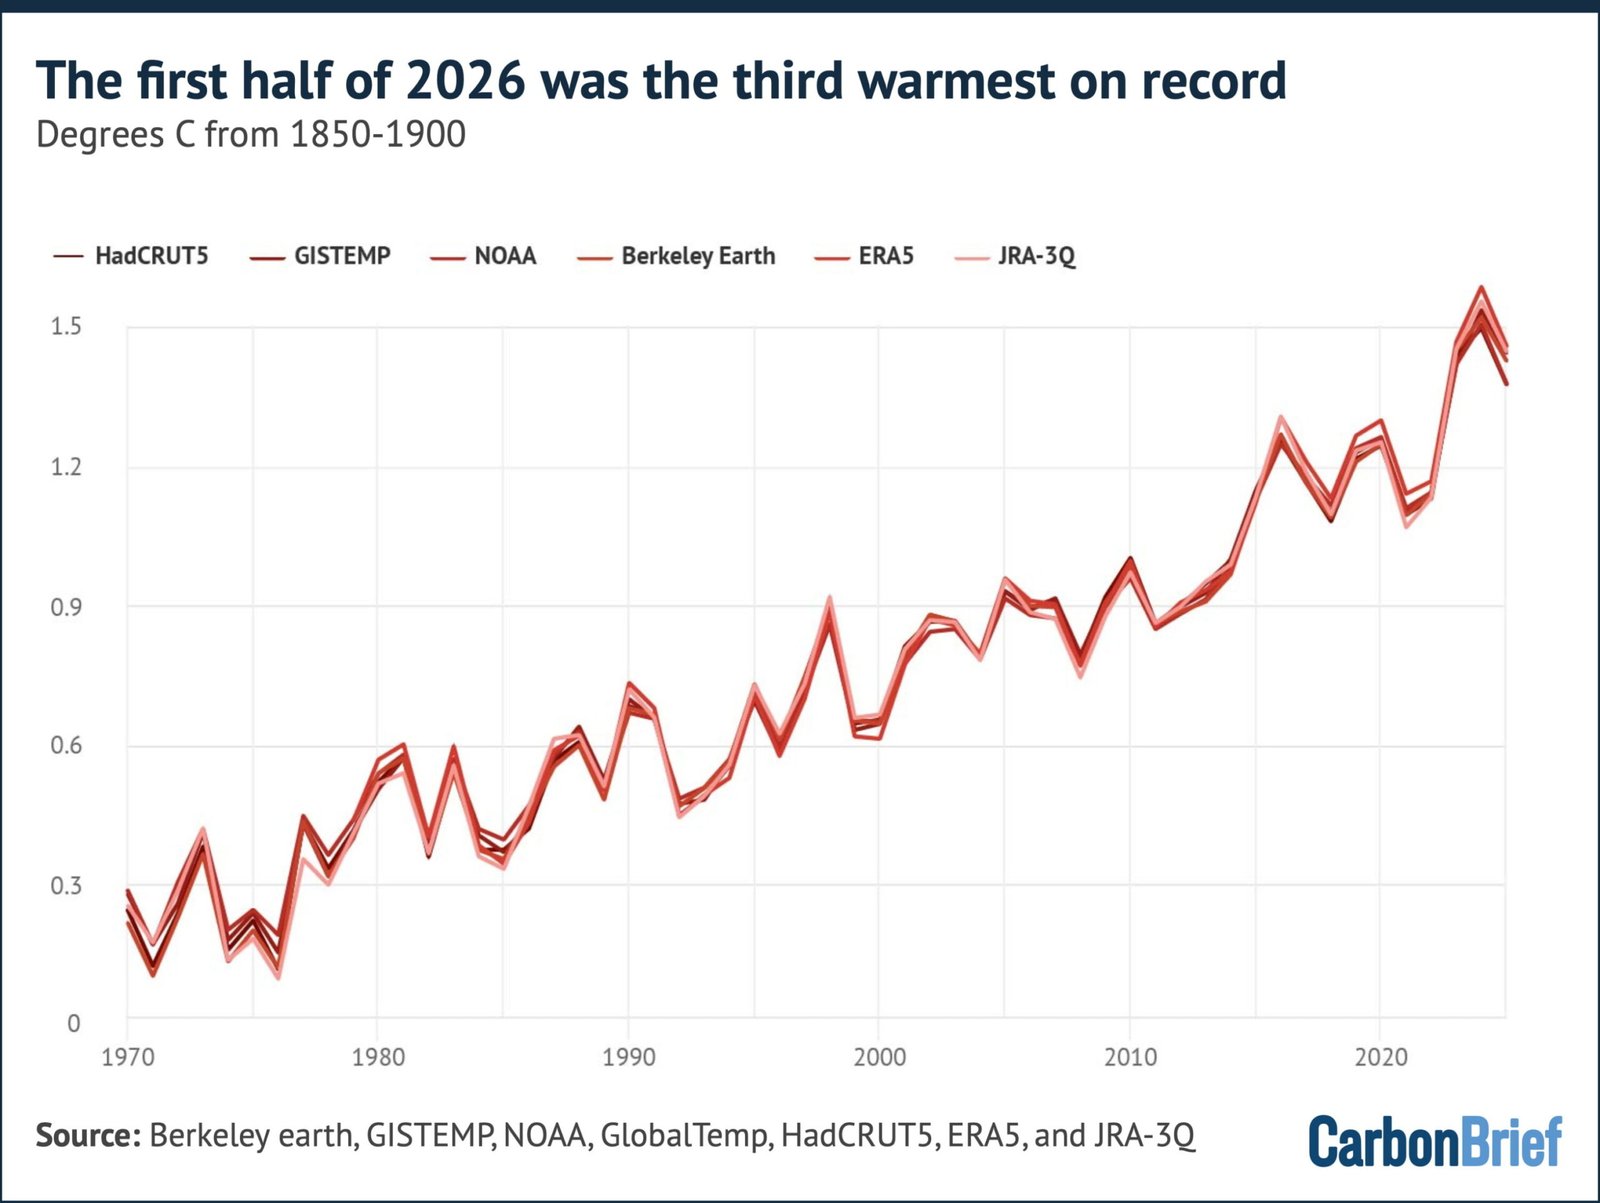
The first half of 2026 was the third warmest on record in every one of the six datasets, behind only 2024 and 2025. The figure below shows annual temperatures since 1970, along with the 2026 year-to-date average (January-June) for each group.
January 2026 was only the fourth- or fifth-warmest January on record, as lingering weak La Niña conditions suppressed temperatures. Since then, each month has climbed the rankings.
La Niña is the cool phase of the El Niño-Southern Oscillation (ENSO). It typically brings wetter conditions to Australia, Indonesia and equatorial South America and drier conditions to the southern US.
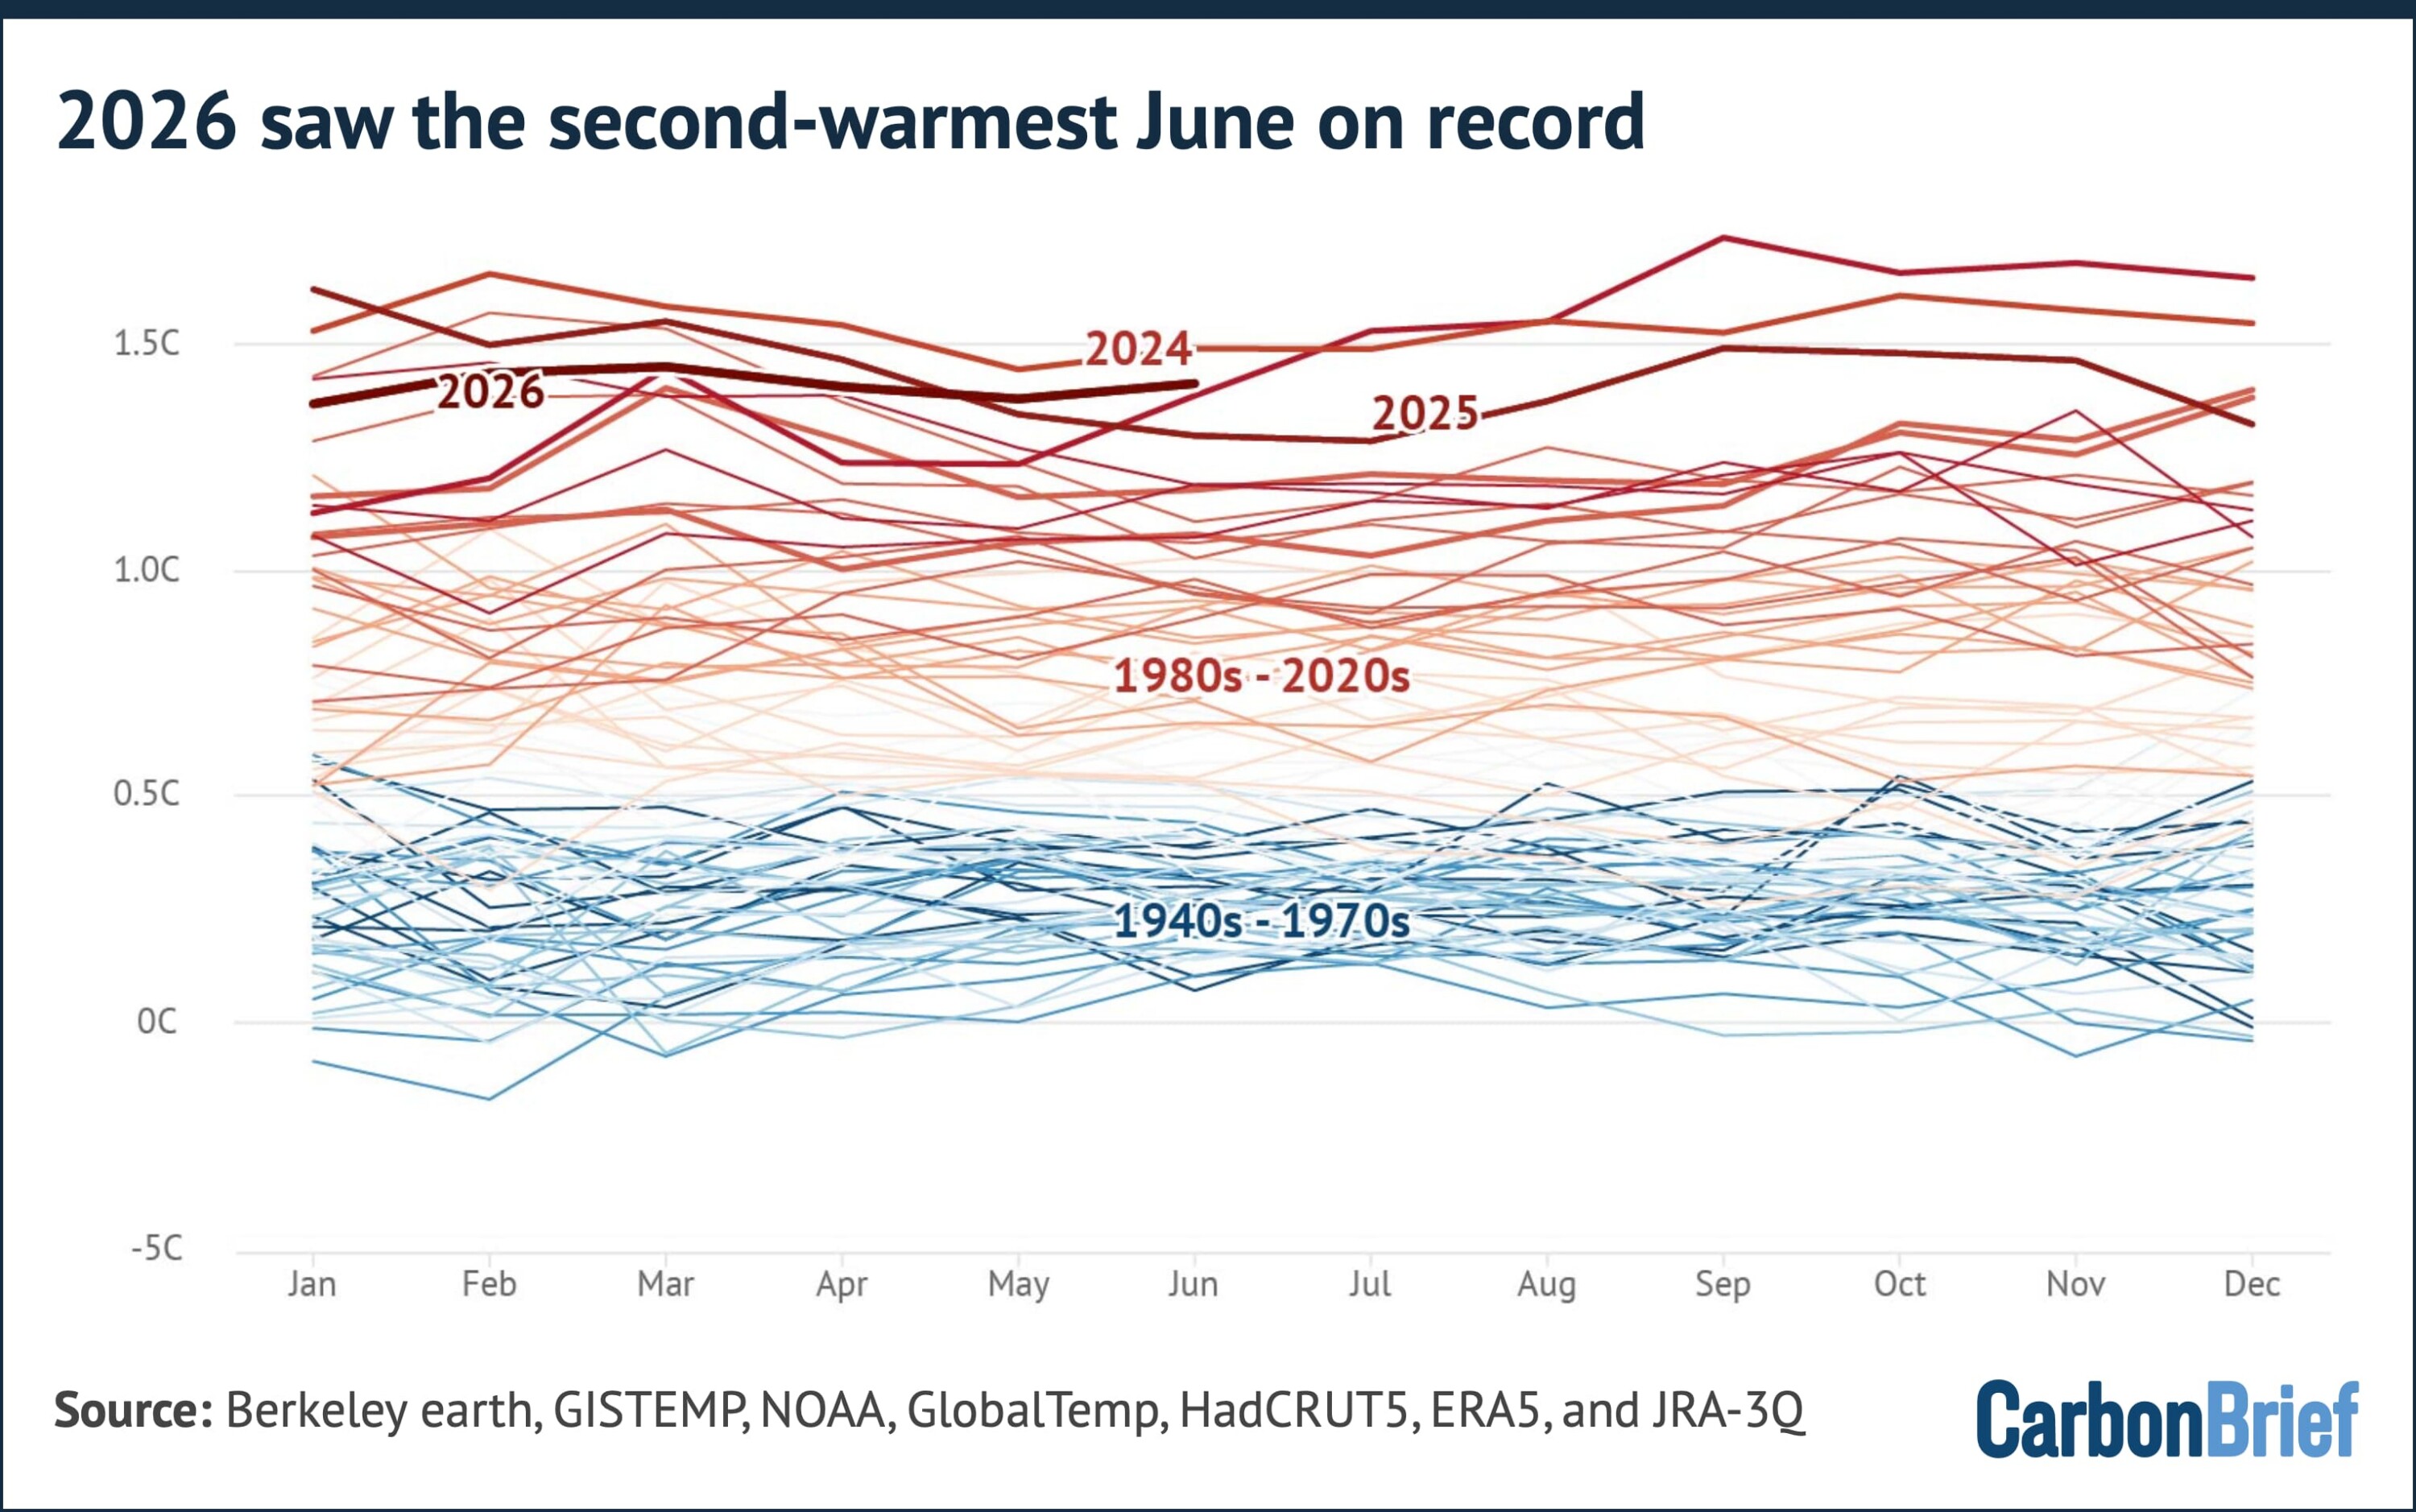
March was second-to-fourth warmest across datasets, April the third and both May and June were the second warmest ever recorded, behind only the corresponding months of 2024.
The chart below shows how June 2026 (thick red line) came in around 0.08C below the June record set in 2024 in the average of the six datasets.
Meanwhile, Copernicus reported that global sea surface temperatures over the ice-free oceans set a new June record.
A record-breaking El Niño
ENSO is the largest source of year-to-year variability in global temperatures.
The most common way to assess the strength of an El Niño or La Niña event is by looking at the sea surface temperature anomaly in the “Niño3.4” region of the tropical Pacific.
El Niño and its sister La Niña occur when temperatures in the tropical Pacific are more than 0.5C (El Niño) or less than 0.5C (La Niña) below normal, where normal is defined by removing the effects of long-term climate change.
The thresholds for defining the strength of an El Niño or La Niña are above/below 1C for “moderate” events, 1.5C for “strong” events and 2C for “very strong” (or “super”) events.
After two years dominated by La Niña conditions, the tropical Pacific flipped decisively in April when the Niño3.4 index crossed the 0.5C El Niño threshold. It subsequently reached 1C in May and hit 1.6C in June, marking one of the fastest onsets in the observational record.
In the first few weeks of July, the index shot above 2C, significantly outpacing the speed at which any prior El Niño events developed.
Forecast models expect even more to come.
An analysis by Carbon Brief of the median of 667 model runs from 14 different modelling groups suggests that sea surface temperatures in theNiño3.4 region could peak at 3.59C between July and December.
More than 91% of runs predict the strongest El Niño event in the modern record. The previous record was set during the event of 2015-16, when temperatures peaked around 2.75C.
This is shown in the chart below, which features a histogram of the likelihood of different possible 2026 El Niño peaks across all the models on the top. The forest plot beneath shows the best estimate and range of outcomes predicted by each individual model.
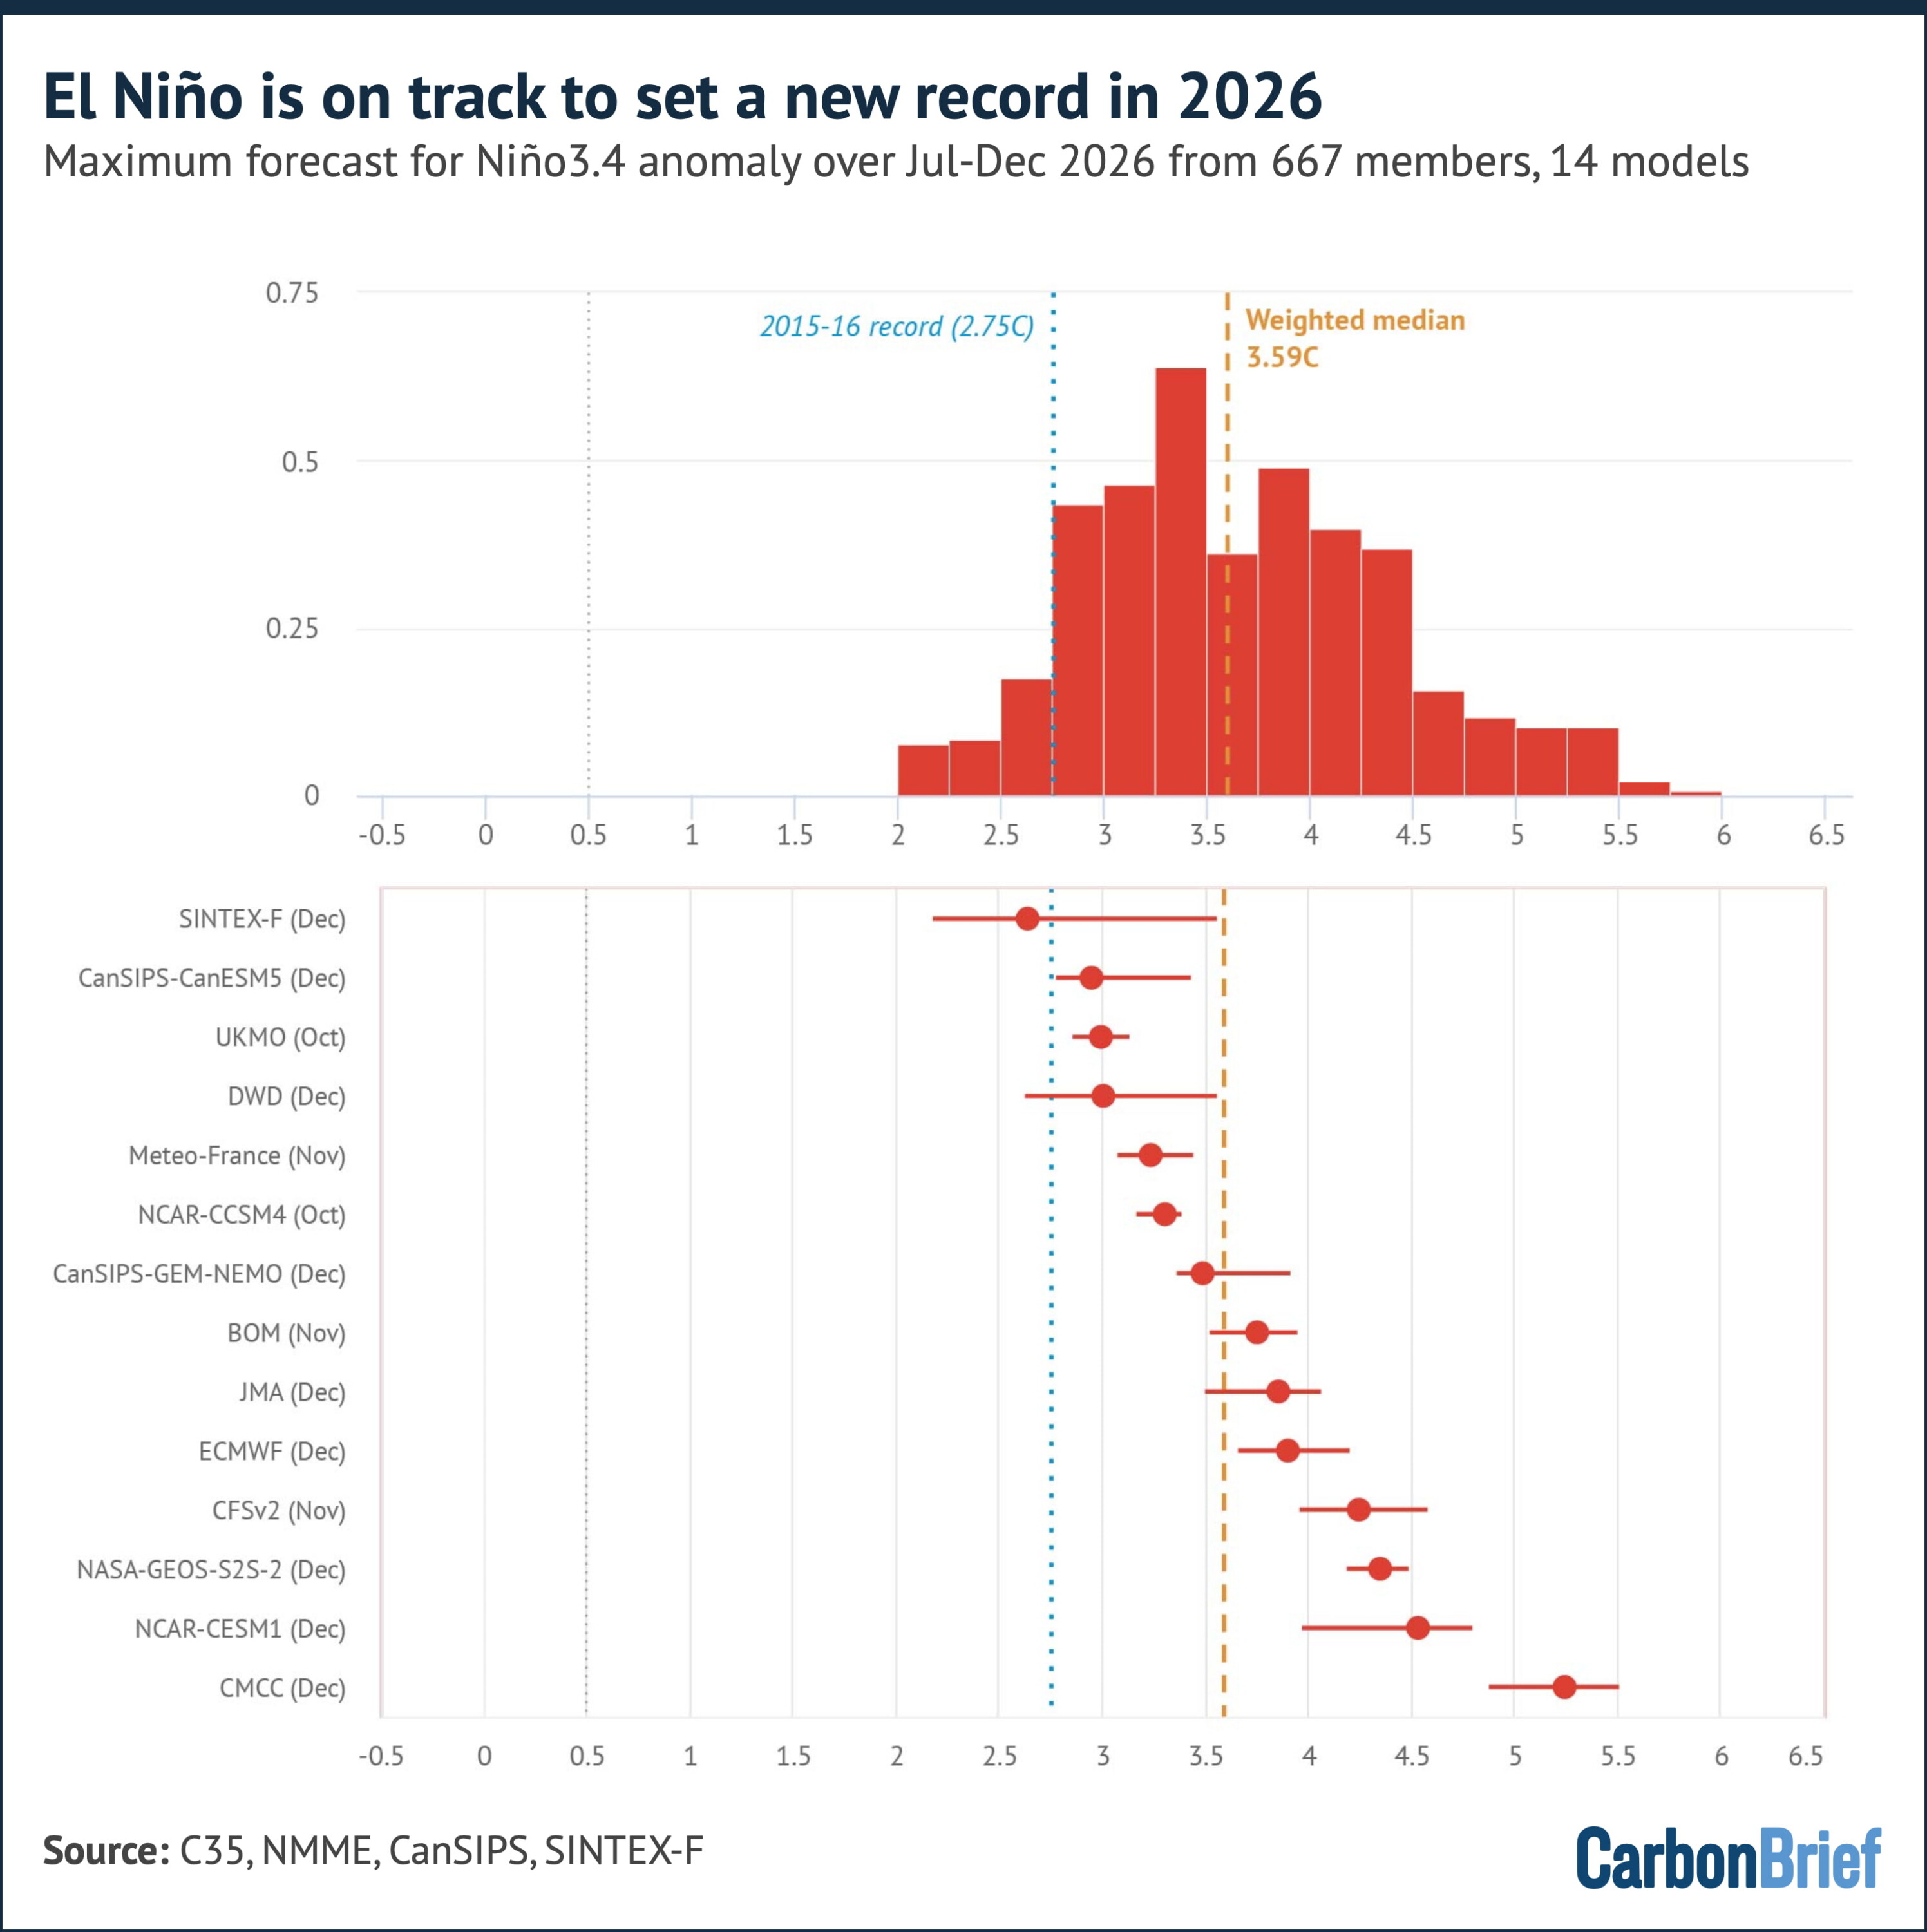
The median forecast in every one of the 14 models suggests a peak that exceeds the 2C “super” El Niño threshold, with most models peaking in November or December.
Some caution here is warranted, however. Raw model Niño3.4 anomalies are measured against a fixed climatology. Because the entire tropical ocean has warmed due to human-caused greenhouse gas emissions, the models tend to overstate event strength relative to the historical record.
A cleaner comparison uses the relative Niño3.4 index (RONI), which subtracts the average tropical ocean warming.
This relative measure suggests the median forecast peak for El Niño in the latter half of 2026 is 3.1C. The prior record stands at a lower 2.69C, set in 1982-83.
Nevertheless, 77% of model runs still show a new record event occurring. This is shown in the chart below.
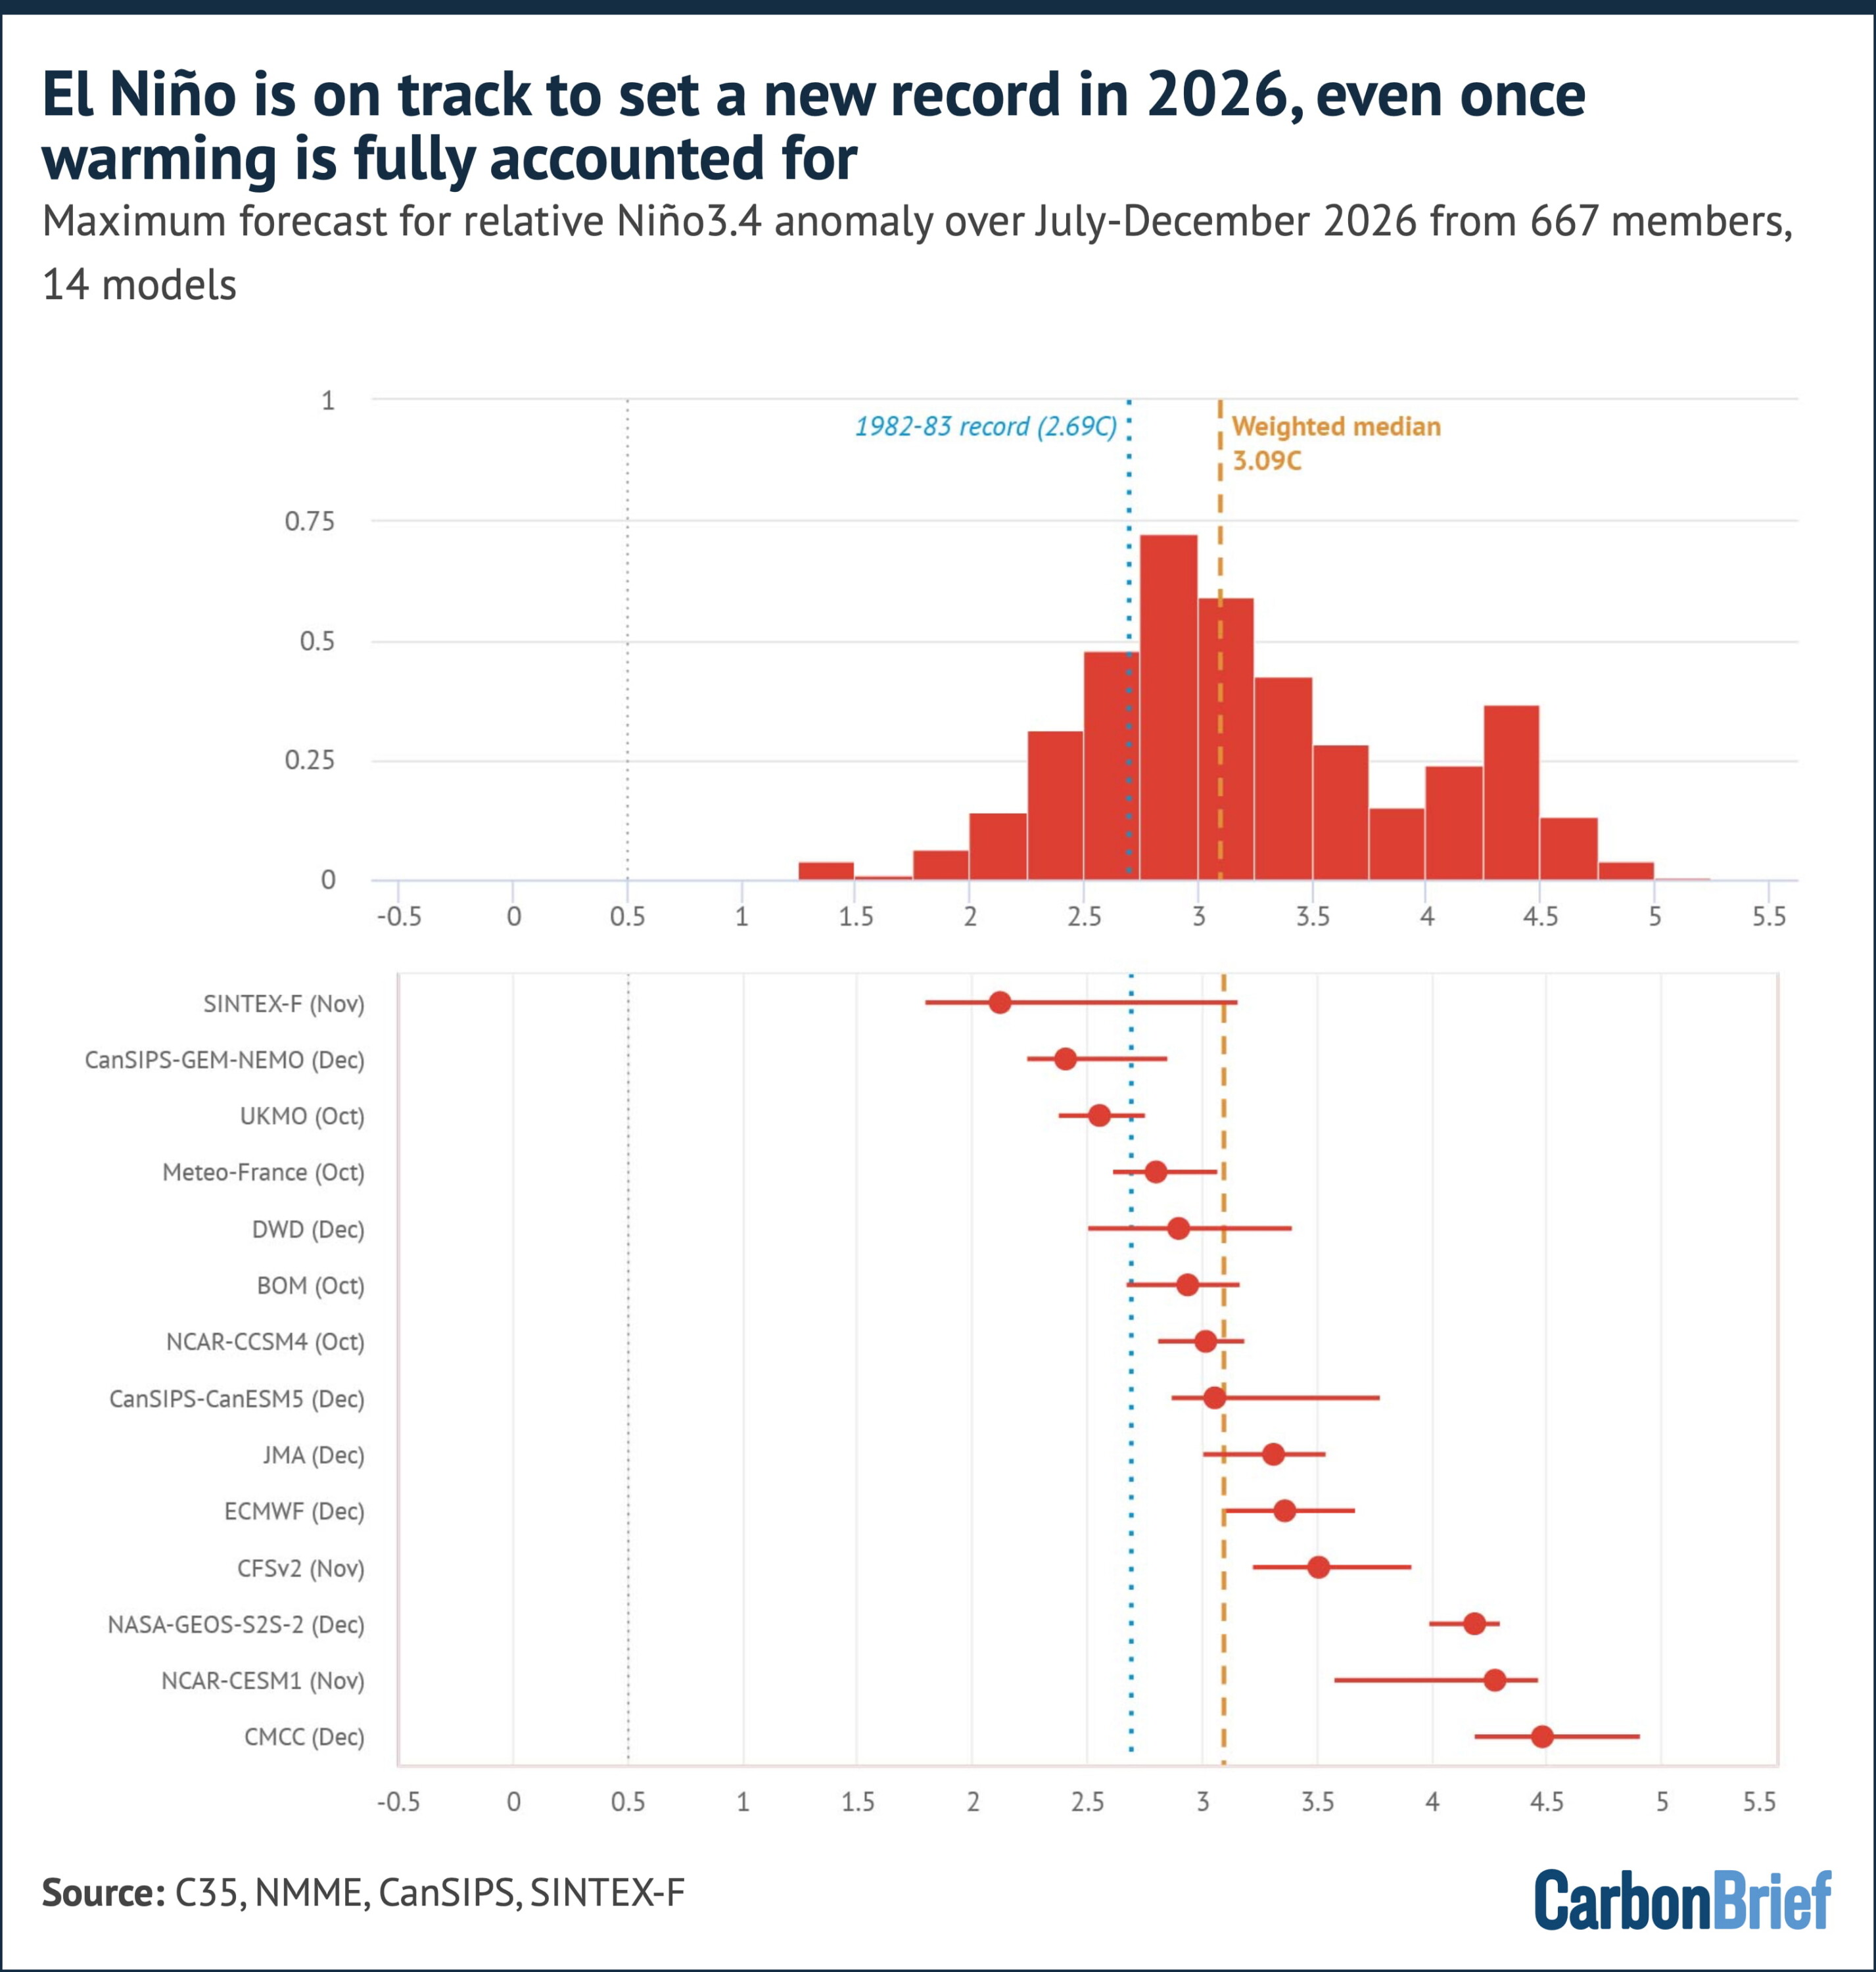
In summary, on both indexes, the central expectation is now for the strongest El Niño in the observational record.
Model forecasts made in the spring and early summer have historically shown some bias toward overpredicting event strength. However, forecasts made after the spring are considerably more reliable.
Widespread record warmth and a massive European heatwave
The map below shows the temperature anomaly for the first half of 2026 in the ERA5 dataset, relative to a 1981-2010 baseline period.
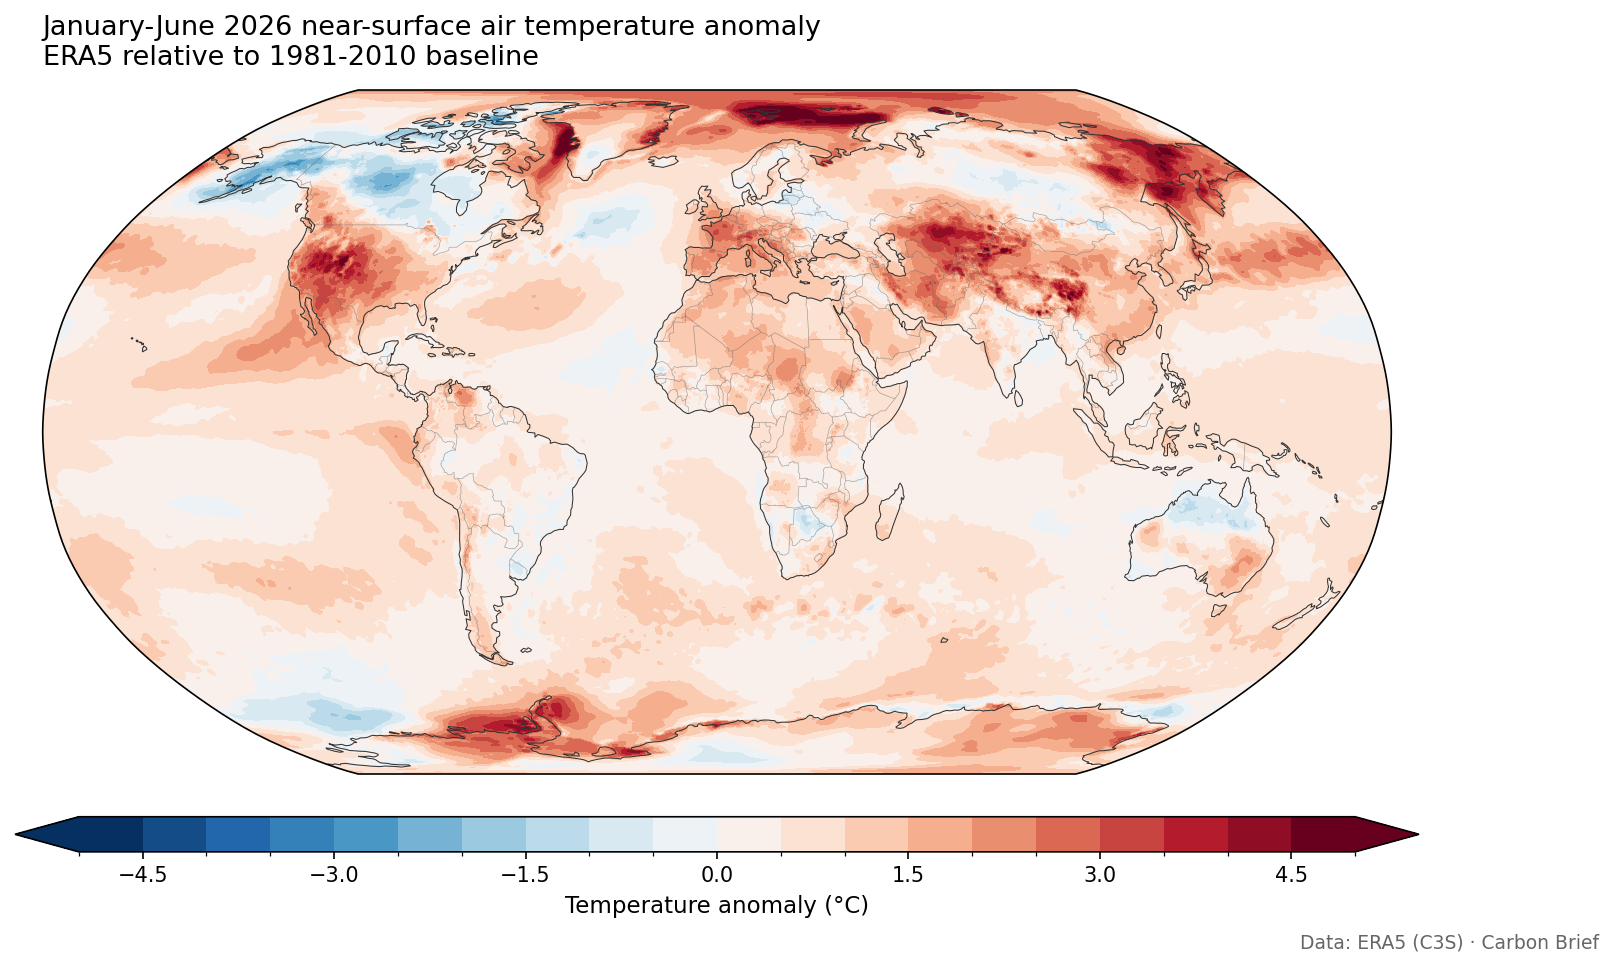
It shows how the largest warm anomalies were found across the Arctic – particularly north of Scandinavia and Svalbard – as well as western Europe, the western US, northern Mexico, central Asia, western China, eastern Russia and the Antarctic Peninsula region.
The developing El Niño is clearly visible as a tongue of warm anomalies stretching along the equatorial eastern Pacific. Only a few regions – central Canada, Alaska and parts of the Southern Ocean – saw temperatures below the 1981-2010 average.
Where 2026 ranks against history is even more striking. The map below shows where the period of January-June 2026 ranked among all 87 years in the ERA5 record, which stretches from 1940 to 2026. Grid cells marked in red saw temperatures in the first half of the year that were in the top-five warmest years.
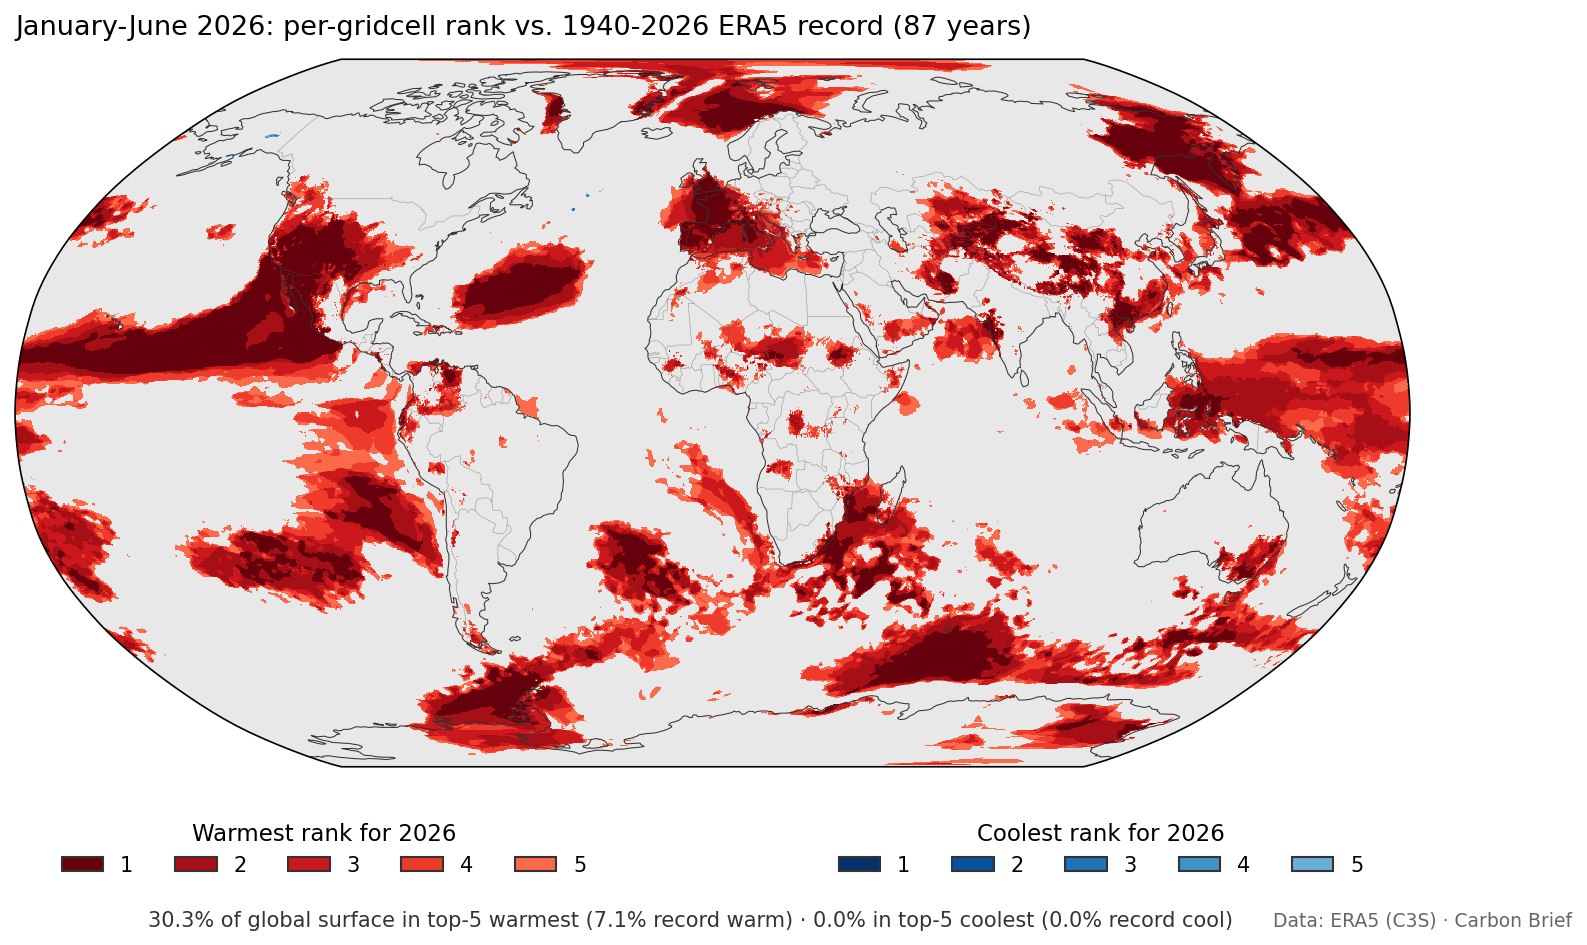
More than 30% of the global surface had a top-five warmest start to the year and 7.1% saw its warmest on record, including much of western Europe, the eastern equatorial Pacific and the seas around Japan.
Not a single grid cell had a top-five coolest start to the year. In June alone, 8.9% of the world’s surface saw record warmth for the month. This is illustrated in the map below, where grid cells marked in red saw temperatures that were in the top-five warmest years and grid cells in blue in the top-five coolest.
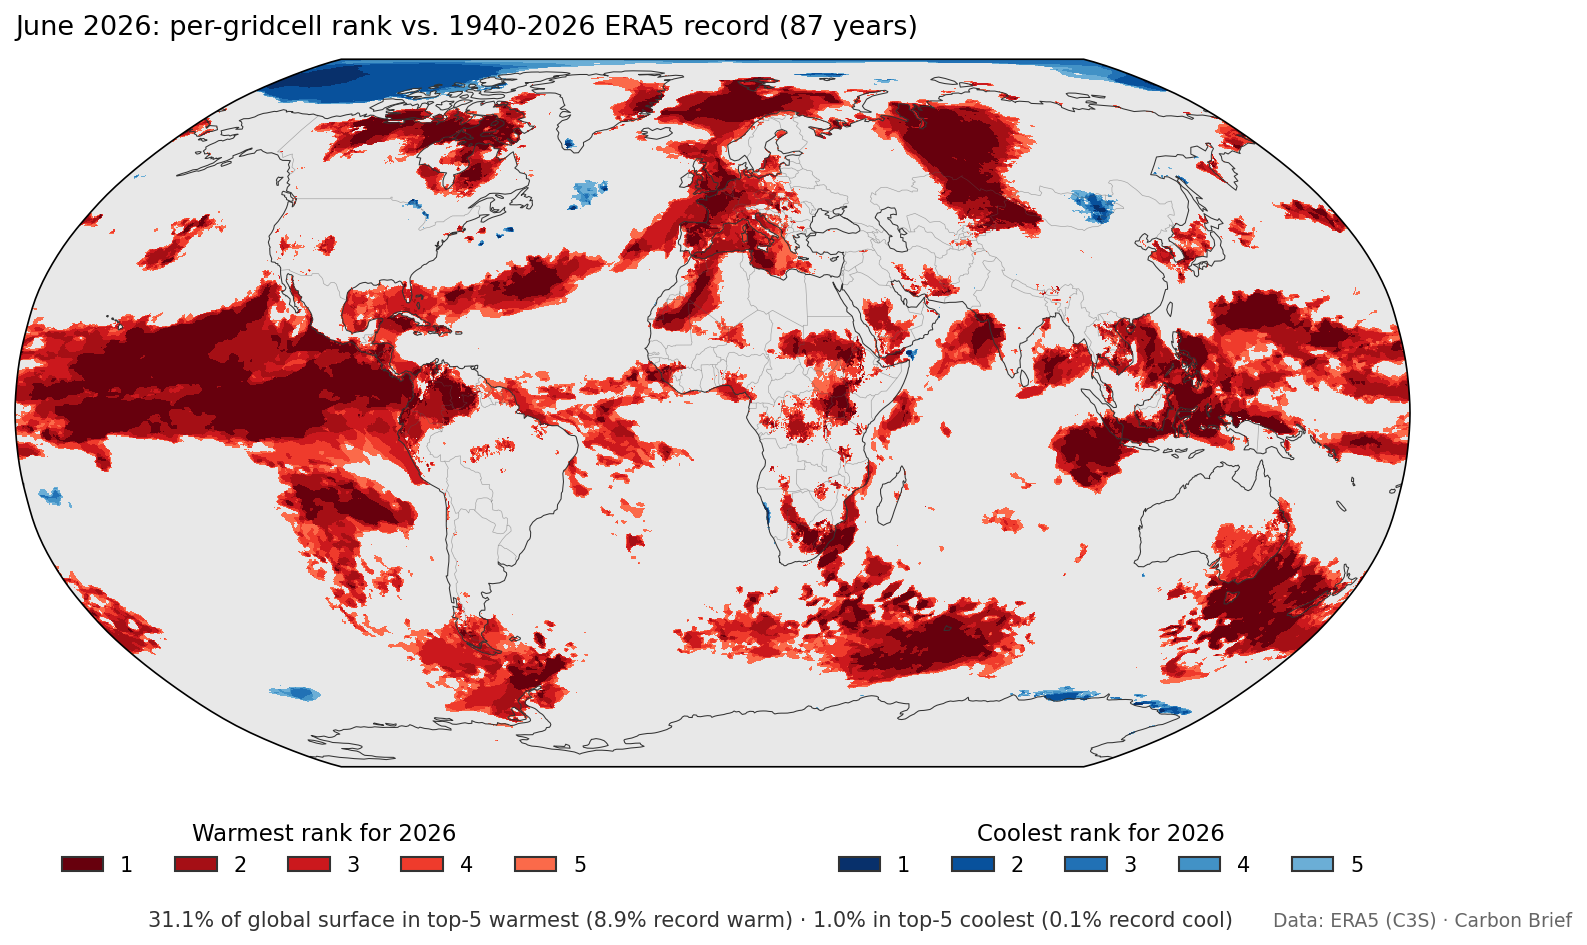
The standout regional temperature event was a heatwave that struck Europe in late June.
Western Europe had its hottest June on record, recording an average temperature of 3.05C above the 1991-2020 average and beating the record set only a year earlier, according to Copernicus. A heat dome over 22-30 June broke 10 all-time national heat records and around 400 long-record station records.
France set a new June national record of 44.3C, while the UK broke its June record on three consecutive days, reaching 37.3C. The humid heat drove a death toll estimated in the thousands.
A separate heat dome also brought record June temperatures to parts of North America in late June.
On track to be second warmest, but a real chance at first
Carbon Brief’s updated projection for 2026 as a whole combines the observed January-June temperatures with the latest El Niño forecast. It uses a statistical model trained on the historical relationship between the first half of the year, ENSO conditions and annual temperatures observed over 1950-2025, excluding major volcanic eruption years.
Carbon Brief estimates that 2026 will be around 1.51C above pre-industrial levels, with a 90% range of 1.45C to 1.57C, shown by the yellow dot in the chart below.
This is up from 1.47C in the projection set out in April – and is notably more certain now that half the year has passed.
This central estimate would make 2026 the second-warmest year on record, just below 2024 (1.52C) and ahead of 2023 (1.43C) and 2025 (1.41C).
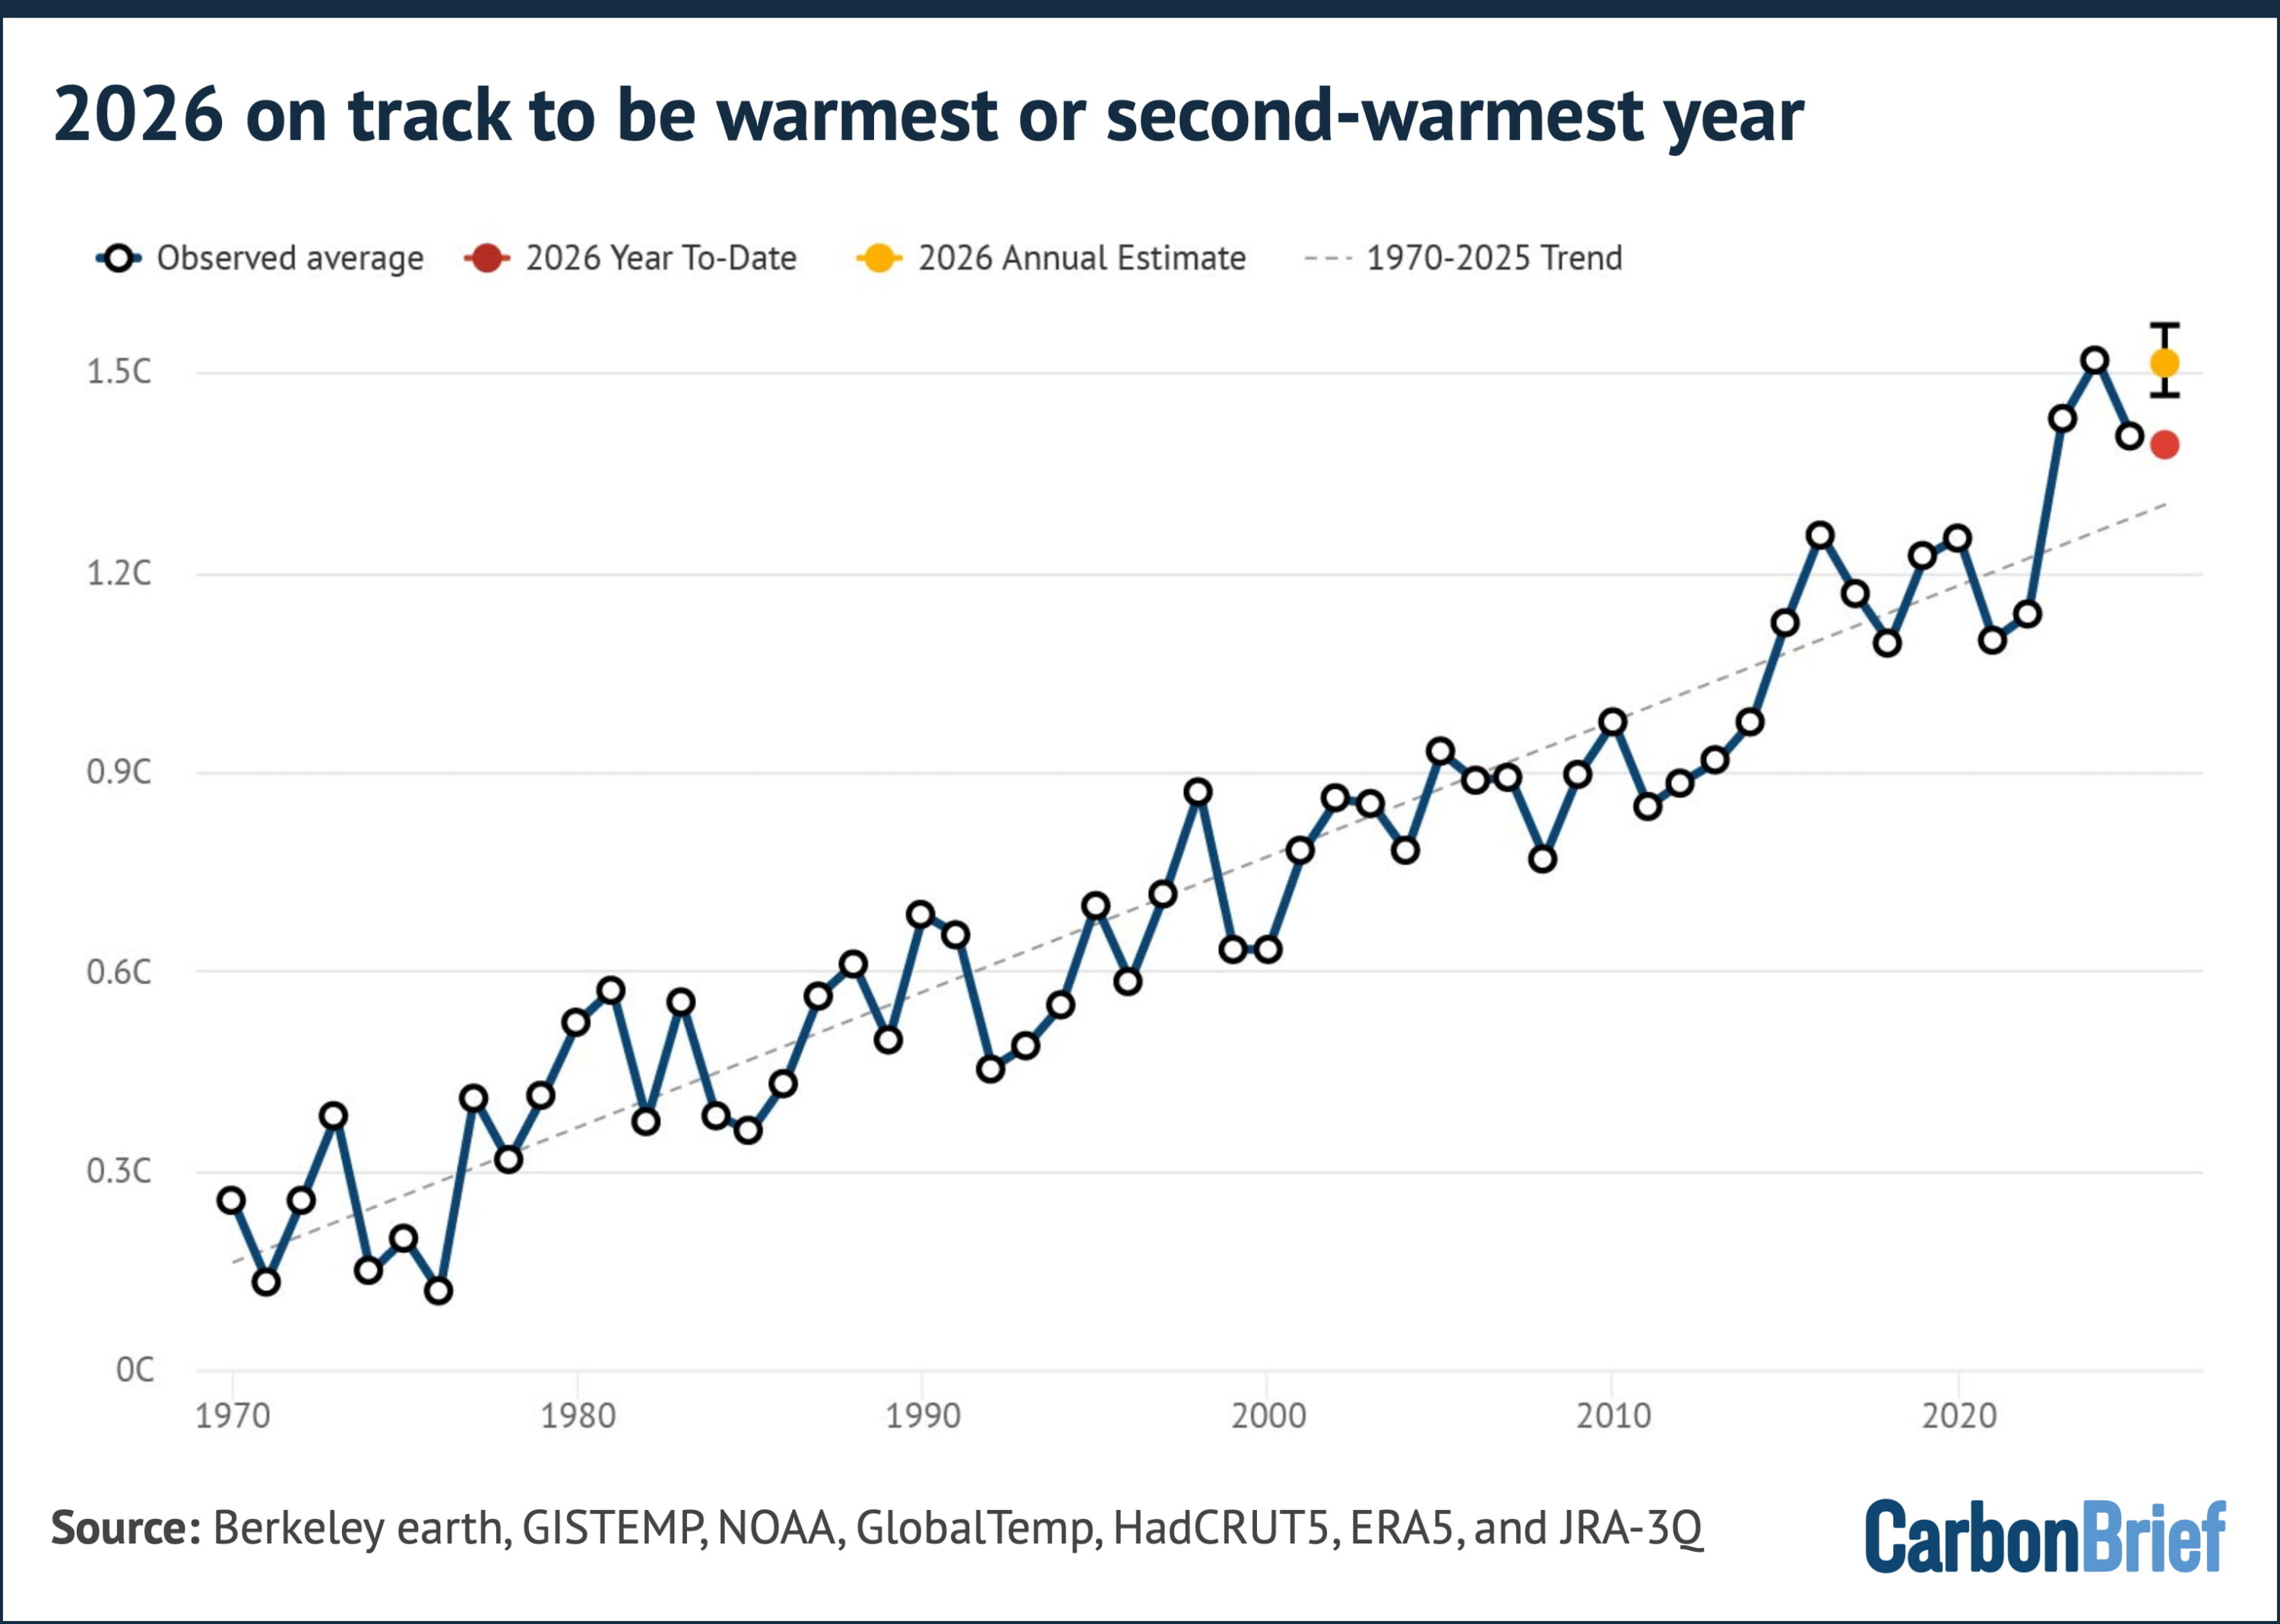
Carbon Brief’s modelling puts the chance that 2026 beats 2024 as the warmest year on record at 35%, using the average of the six different surface temperature records assessed. It puts the chance that 2026 comes in above 1.5C at around 63%.
If it does, 2026 would be the second calendar year – after 2024 – where warming averaged above 1.5C, in a further sign that the world is rapidly approaching the Paris Agreement’s 1.5C limit.
A single year above 1.5C does not by itself constitute a breach of the goal, which refers to the longer term average temperature of the planet. This is defined as the midpoint of a 20-year period by the Intergovernmental Panel on Climate Change (IPCC).
These likelihood of a record have been climbing rapidly throughout 2026.
Global temperatures so far throughout the year have run well below the record-setting levels of 2024 – around 0.13C cooler over the first six months.
On their own, temperatures observed so far in 2026 would make a new annual record unlikely.
However, rerunning the projection using only the data available at the end of each month since March – including both the year-to-date observations and the El Niño forecast issued that month – shows a shifting picture.
Using March data, 2026 had just a 7% chance of setting a new record. That rose to 16% in April, 24% in May, 27% in June and 35% using the latest data in mid-July.
This is shown in the chart below.
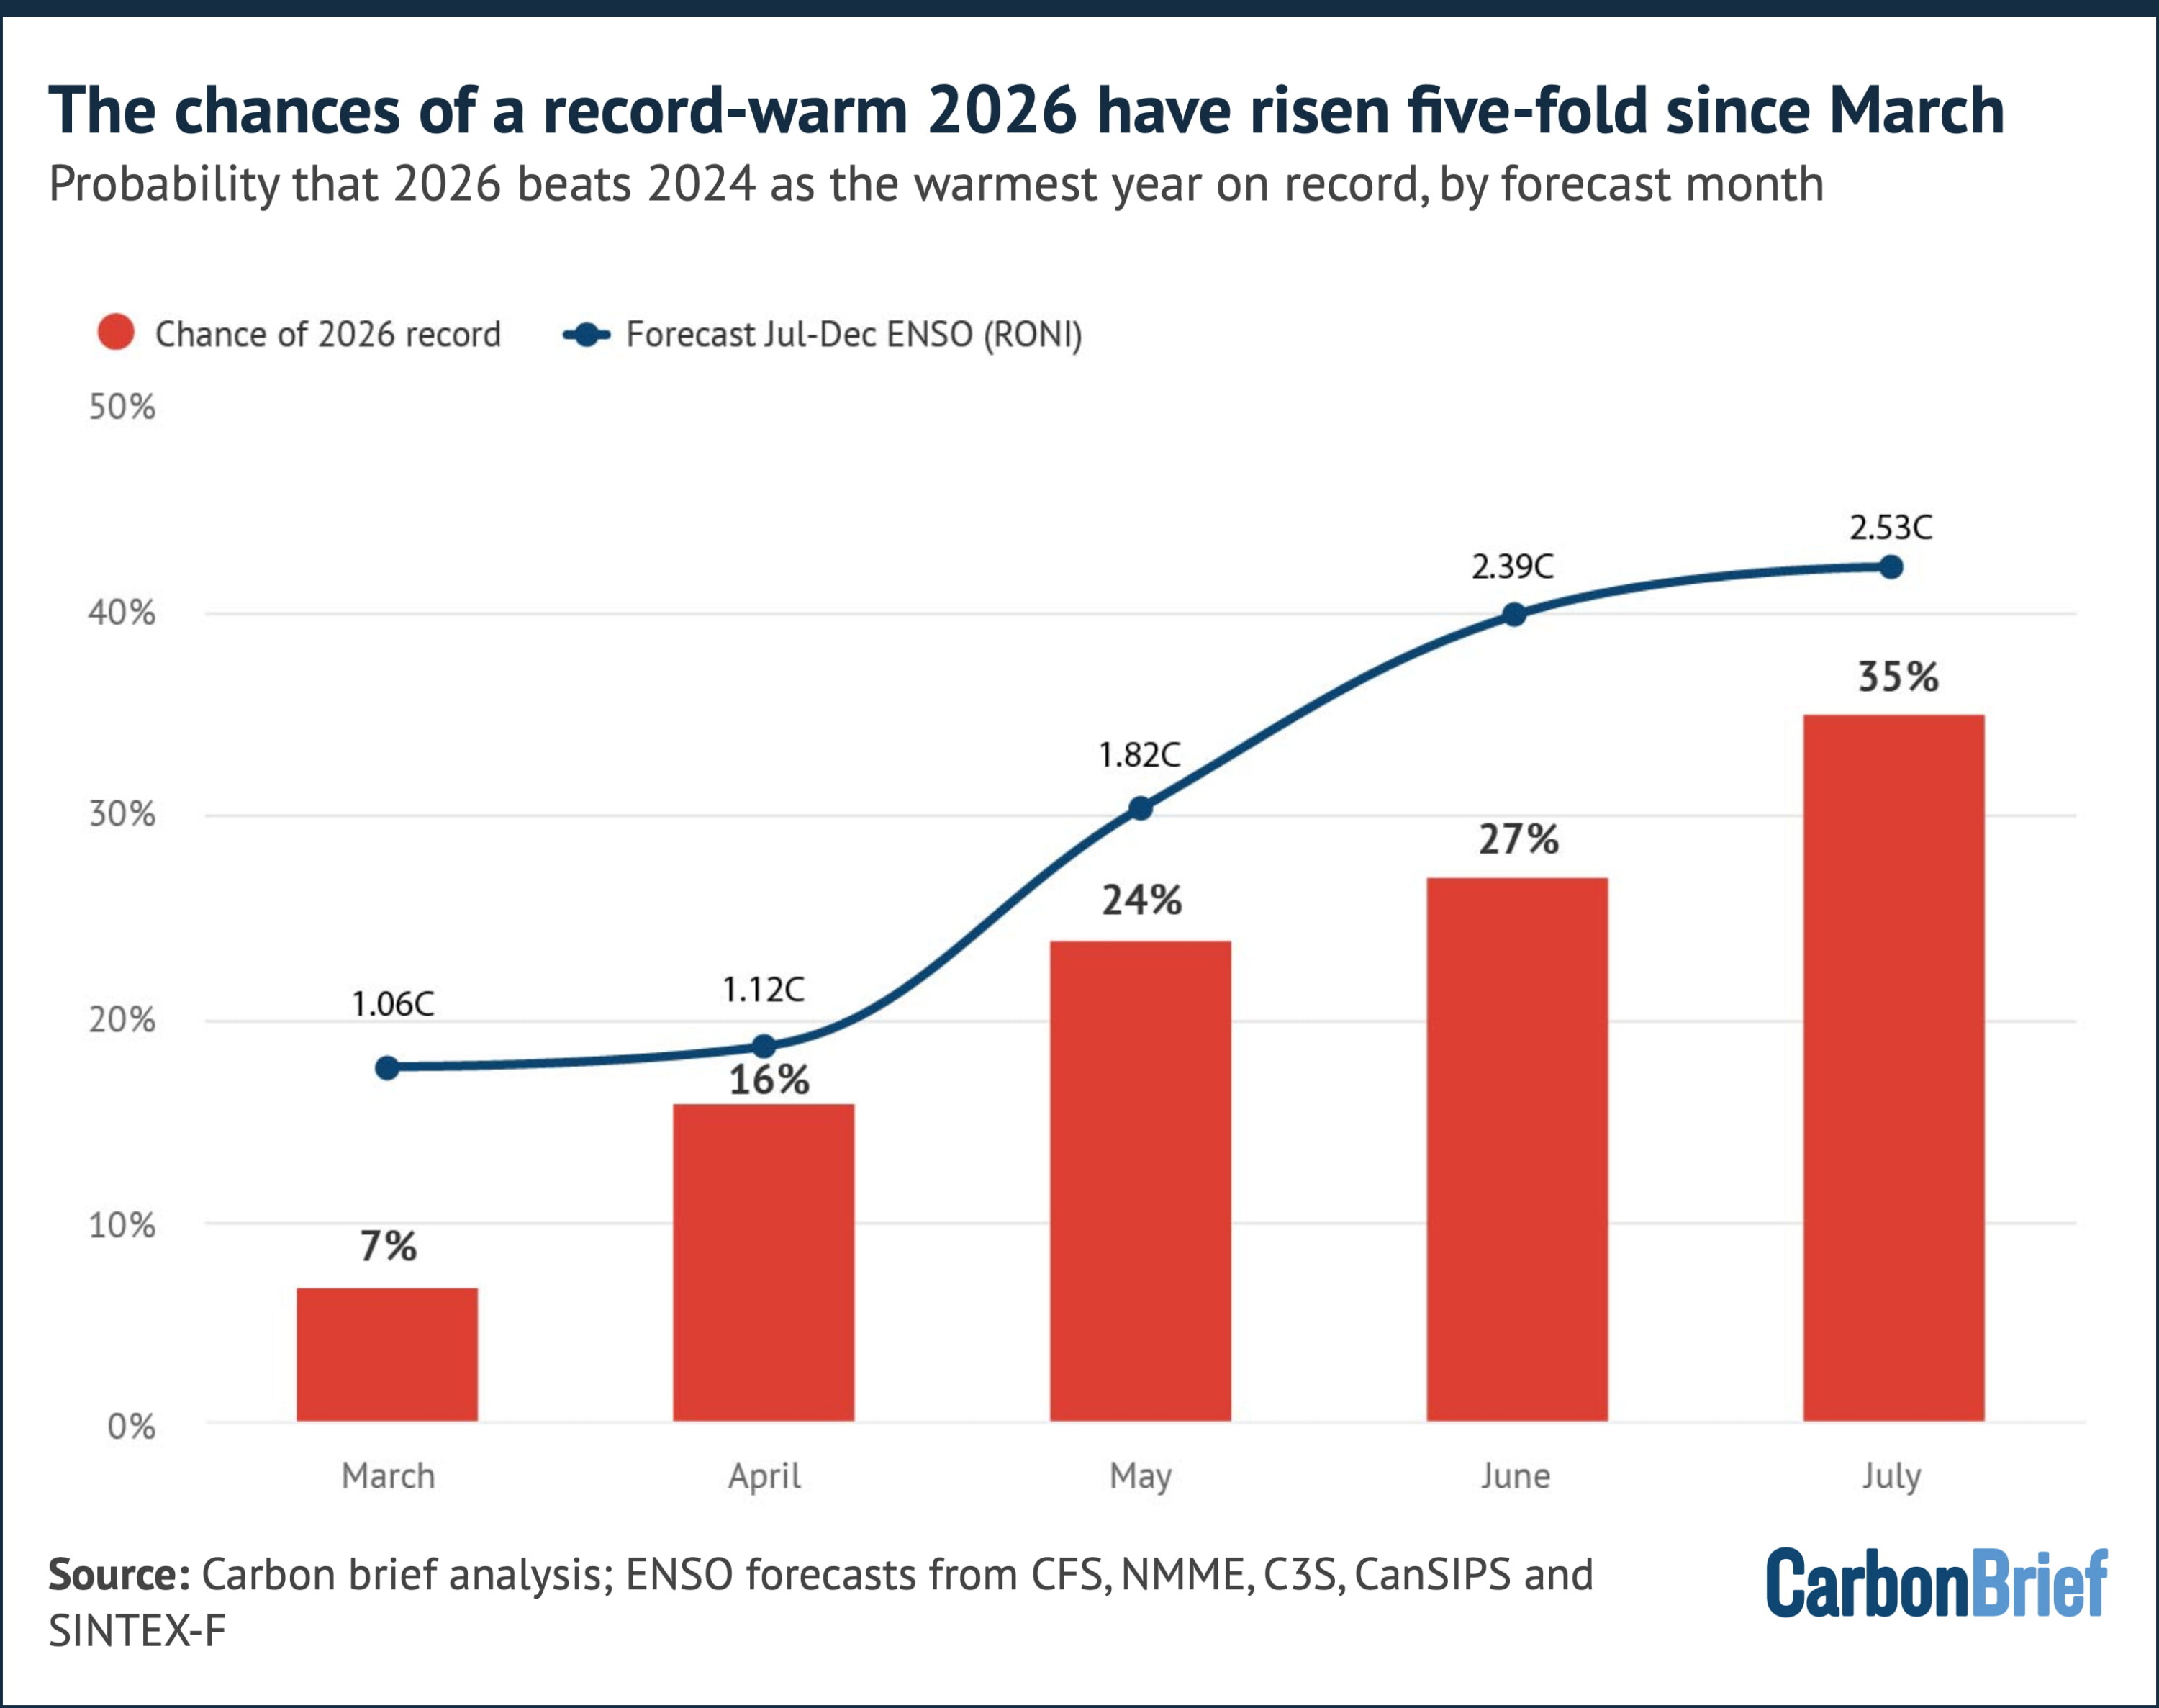
Notably, this rise has little to do with observed temperatures. The year-to-date anomaly has actually drifted slightly down, from 1.41C after March to 1.39C after June.
Observed temperatures and fewer remaining months of the year contributed only around four percentage points of the 28-point rise in the likelihood; the remaining ~84% of the change comes from successive upward revisions to the El Niño forecast for late 2026.
However, whether 2026 ends up becoming the warmest year on record may end up depending on which dataset is used.
Running the same projection gives odds of a 2026 record of around two-in-three for Berkeley Earth (66%) and NASA GISTEMP (65%), but only 35% for HadCRUT5, 24% for NOAA and just 13% and 9% for the ERA5 and JRA-3Q reanalyses, respectively.
This is shown below.
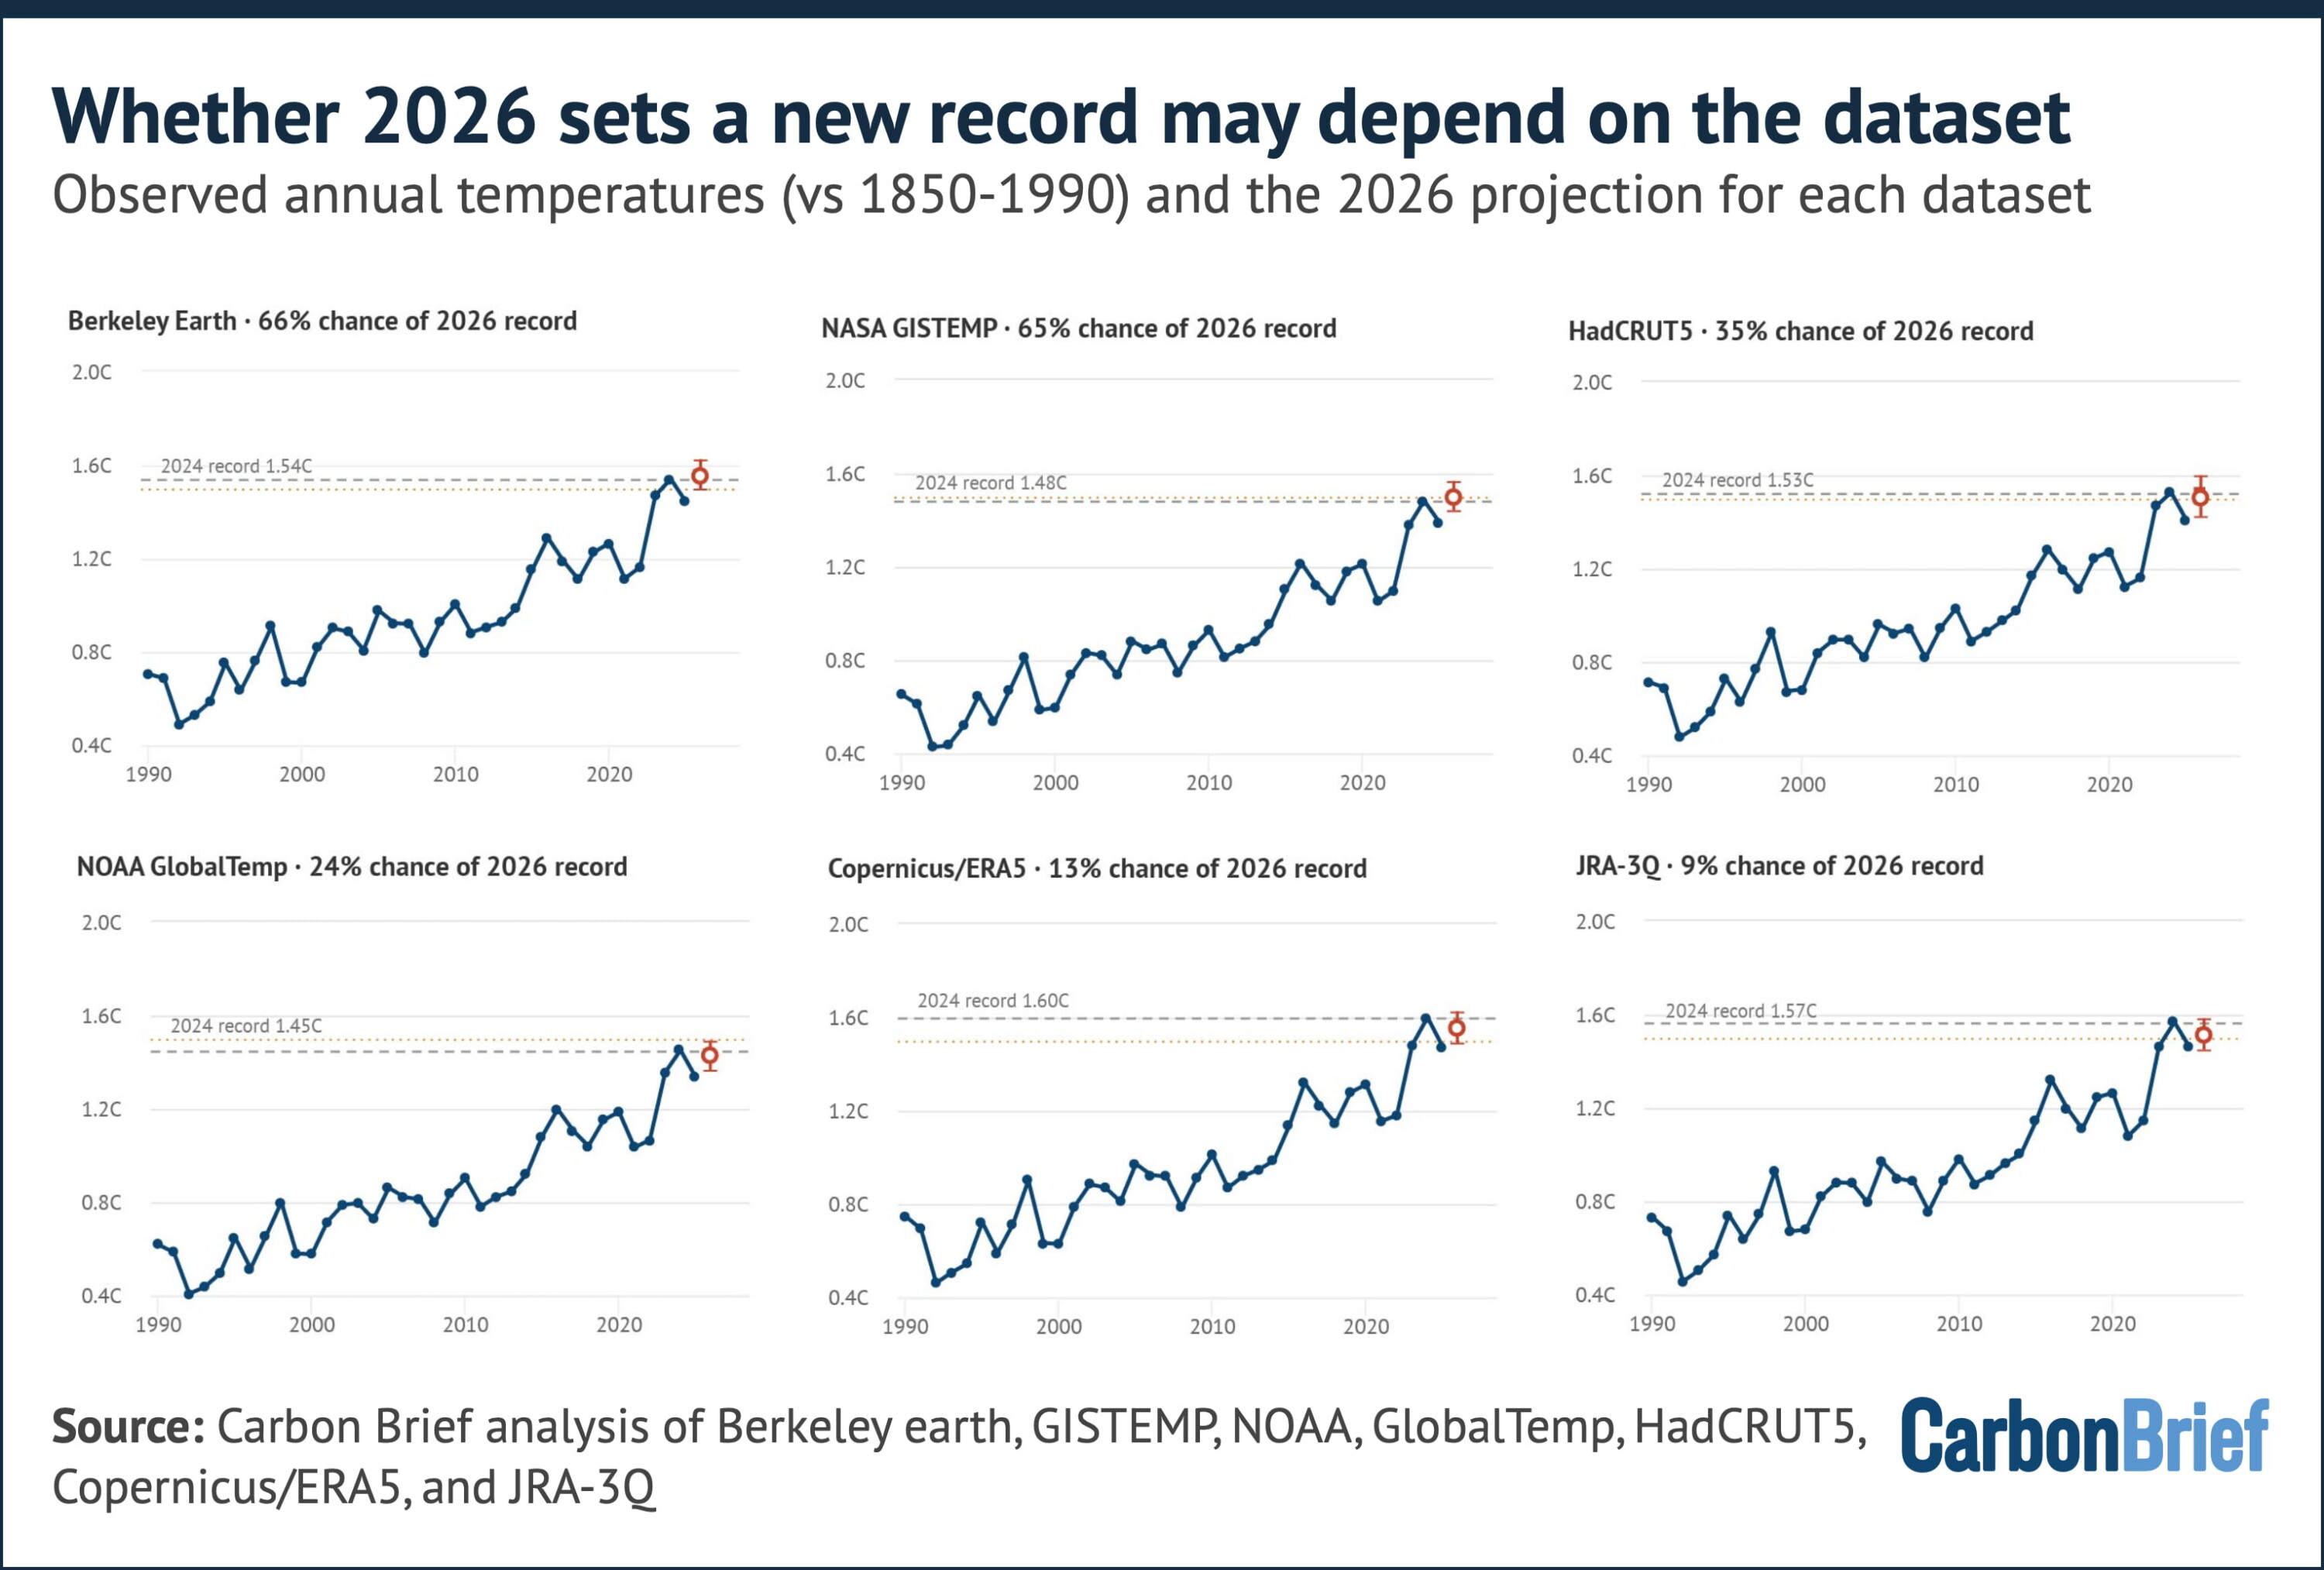
The divergence between projections mostly reflects how exceptional each dataset’s 2024 was.
The reanalysis approaches recorded a particularly warm 2024, leaving 2026 more ground to make up. GISTEMP and Berkeley, on the other hand, project 2026 modestly above their 2024 values.
A repeat of the situation in 2015 where different groups disagreed on record rankings is a real possibility. Headlines in January 2027 may hinge on choices of dataset.
2027 likely to be the warmest year in human history
The biggest climate story of the developing super El Niño may not be 2026 at all.
Global temperatures typically lag in the tropical Pacific by around three months. So, an El Niño event peaking in November and December 2026 will have its largest warming influence on 2027.
We saw this same pattern occur in 1997-98, 2015-16 and 2023-24 – where the year in which the El Niño developed was warm, but the following year was record-smashing.
Carbon Brief has extended its projection into 2027 by using the historical relationship between year-over-year temperature changes and ENSO conditions in the preceding autumn.
This yields a best estimate for 2027 of around 1.71C above pre-industrial levels, with a 90% range of 1.49C to 1.93C. This is shown by a yellow square on the chart below.
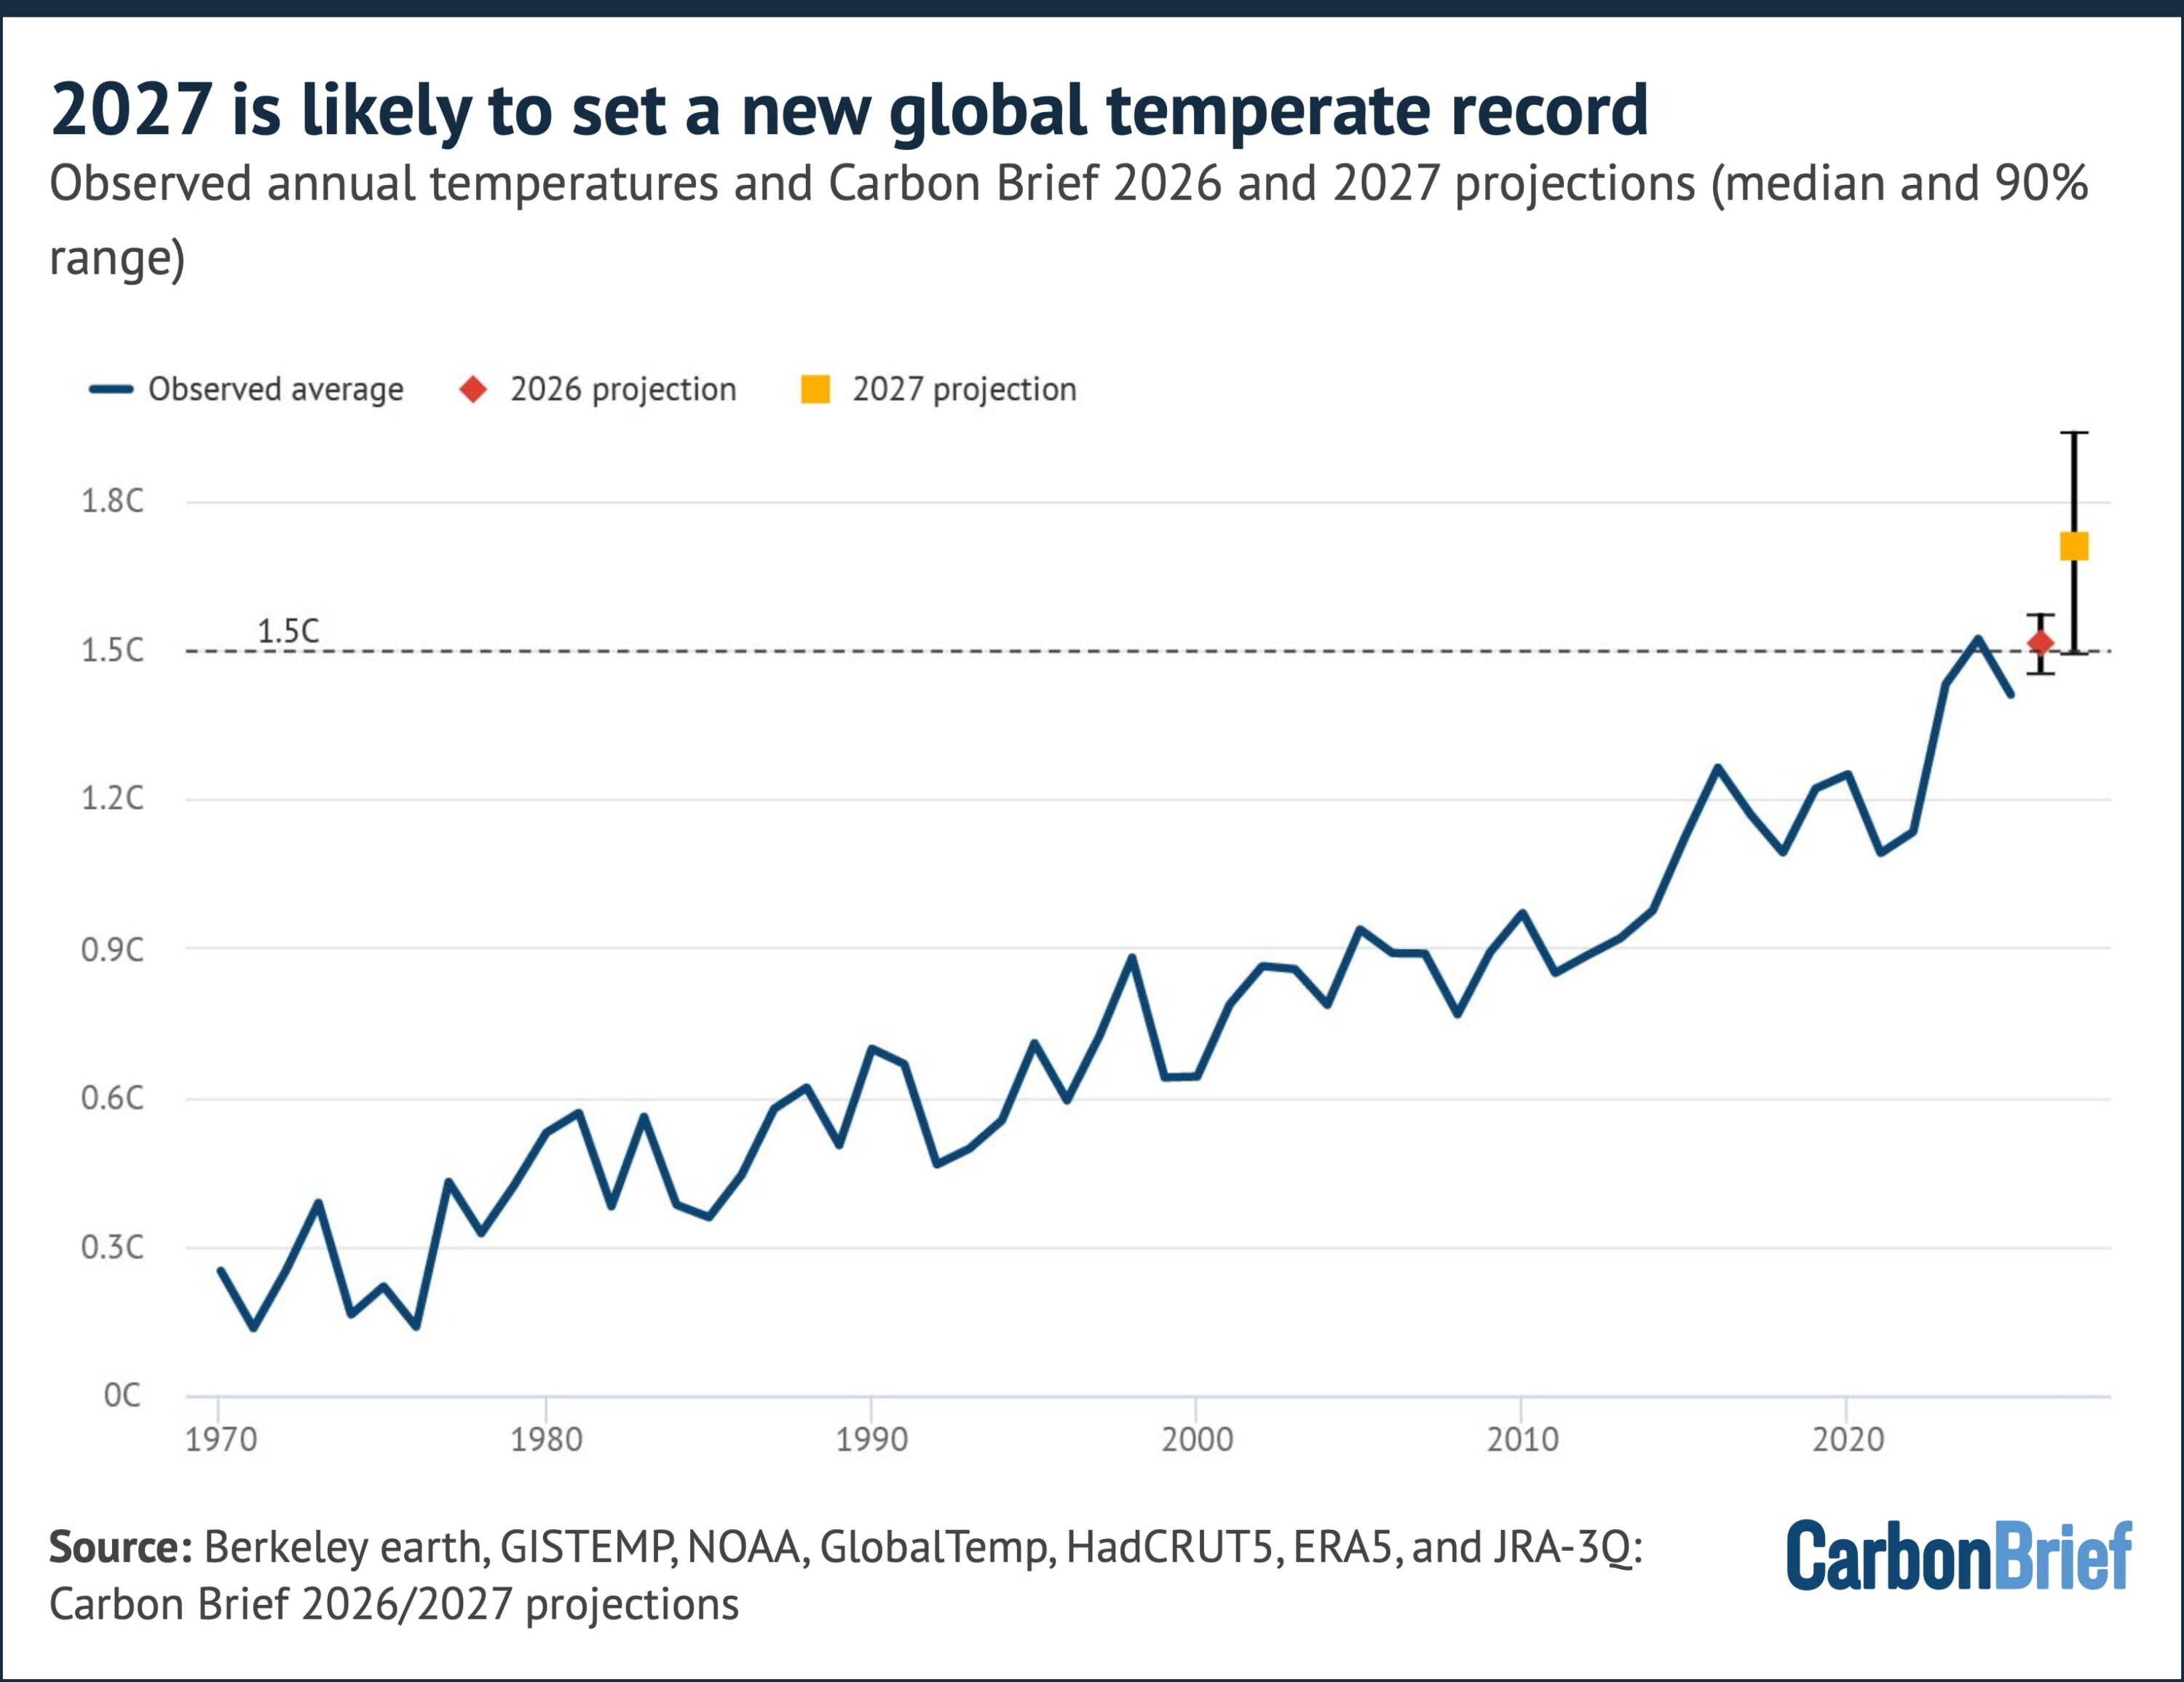
That would give 2027 a 92% chance of setting a new global temperature record and a 94% chance of exceeding 1.5C.
Taking 2026 and 2027 together, there is a 93% chance that at least one of the two years sets a new record.
The 2027 estimate is more uncertain than the 2026 one. As with 2026, there are uncertainties in the projection due to unknowns around exactly how strong the El Niño peak proves to be and how quickly it decays.
However, even the low end of the 2027 range would put it among the warmest years on record and the central estimate of 1.71C would exceed 2024 by nearly 0.2C.
If these projections bear out, the 2020s will have delivered new global temperature records in 2023, 2024 and 2027 – and potentially 2026 too – with a number of individual years well above the 1.5C threshold.
The long-term warming trend, driven by human emissions of carbon dioxide and other greenhouse gases, has increased from around 0.18C per decade in the early 2000s to around 0.27C per decade today. El Niño and La Niña play a big role in determining which years along that rising path stand out as records.
Arctic sea ice at record lows
Arctic sea ice has spent much of 2026 in record-low territory.
Following the joint-lowest winter maximum in the satellite record in mid-March, daily extent has set or tied record lows for the date on 39 days so far this year, including extended spells in mid-to-late March and in early-to-mid June.
The most recent record-low days were in early July.
The chart below shows how Arctic sea ice in 2026 (dark red line) has been below the historical range (shaded red).
It also shows how Antarctic sea ice (dark blue), meanwhile, has remained below the 1979-2010 range for almost all of 2026 to date.
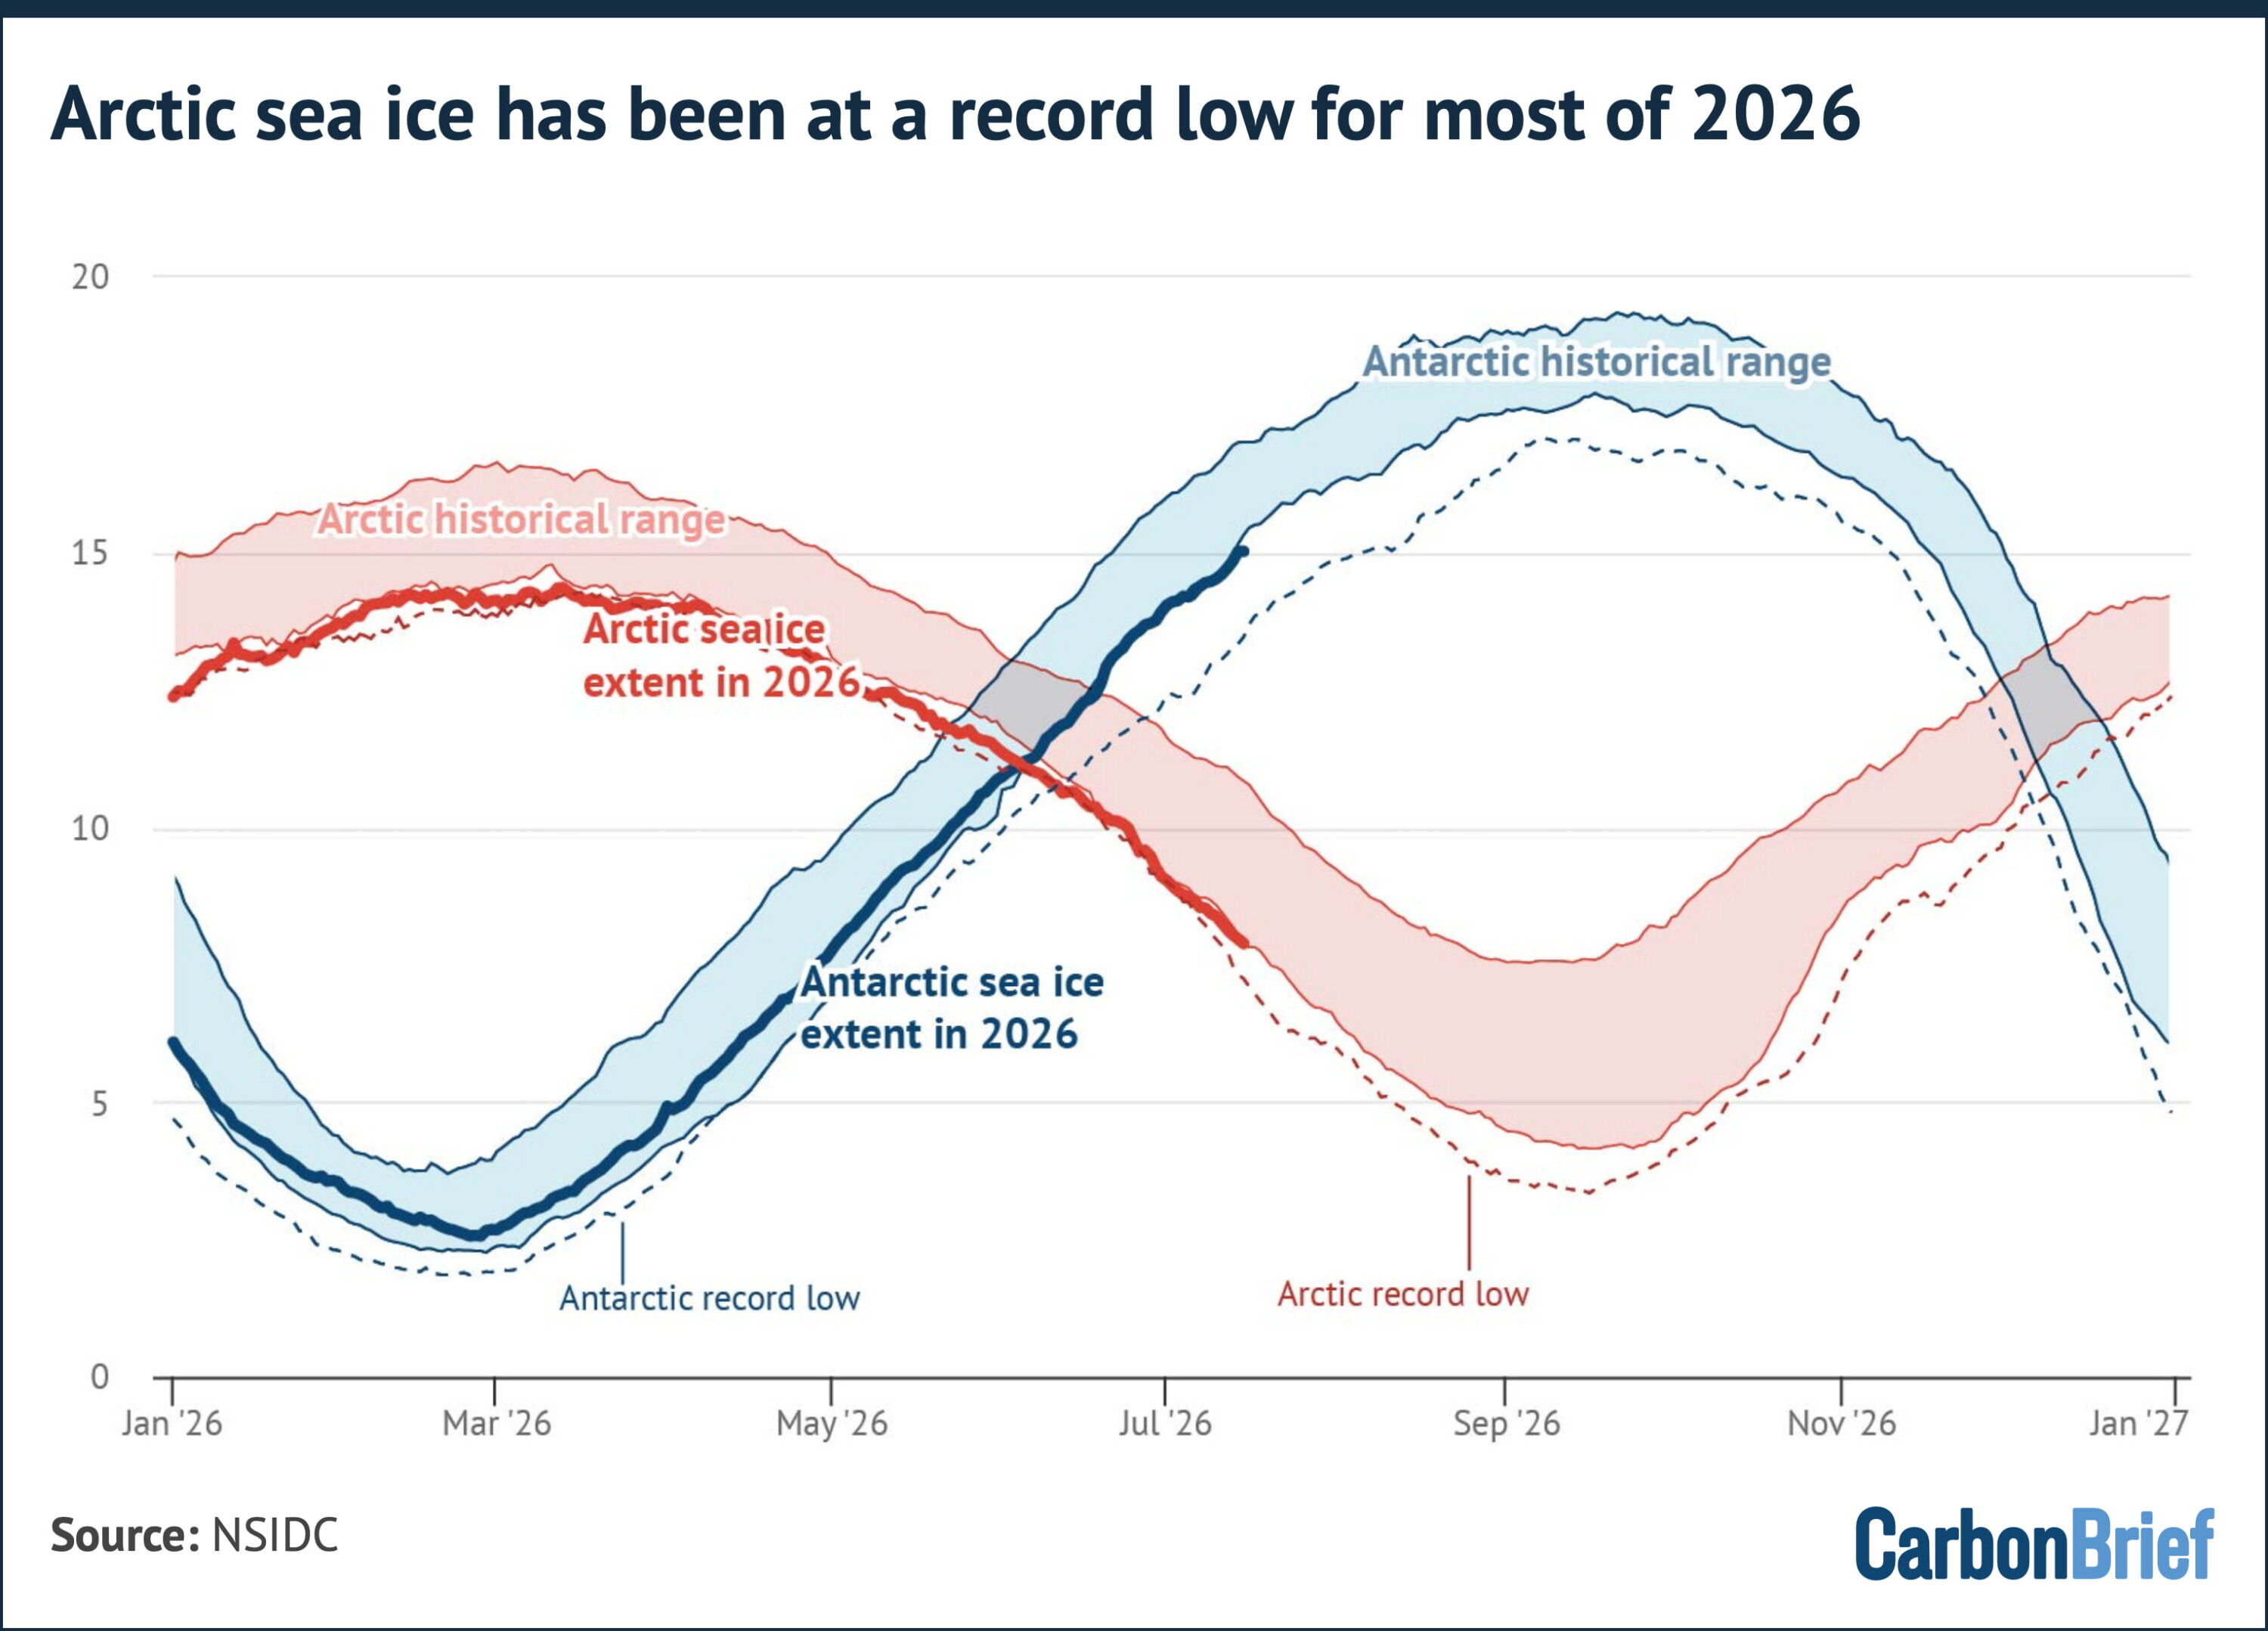
As of mid-July, Arctic extent is a bit below the 1979-2010 historical range for the date, though it remains around 0.6m square kilometres (km2) larger than the record low for the date set during 2020’s exceptional summer melt season.
The trajectory over the coming two months will determine whether 2026 challenges 2012’s record September minimum. Early-summer conditions are a poor predictor of the September minimum, which depends heavily on summer weather.
Antarctic sea ice, meanwhile, is currently around 300,000km2 below the historical envelope, but has stayed well clear of the record lows set in 2023 and has not set any new daily records yet this year.

Q&A: Europe’s May and June heatwave deaths – and how they were counted

Guest post: France’s June heatwave caused more than 2,700 heat-related deaths

Guest post: Climate change has caused one-fifth of Pine Island glacier retreat

Media reaction: How climate change intensified Europe’s record-breaking June heat
The post State of the climate: Rapidly developing El Niño raises chance of record-warm 2026 appeared first on Carbon Brief.